
Compare Bombay Super Hyb with Similar Stocks
Dashboard
Negative results in Mar 26
- PAT(Q) At Rs 4.41 cr has Fallen at -33.4% (vs previous 4Q average)
- ROCE(HY) Lowest at 14.56%
- NET SALES(Q) At Rs 66.43 cr has Fallen at -17.9% (vs previous 4Q average)
Despite the size of the company, domestic mutual funds hold only 0% of the company
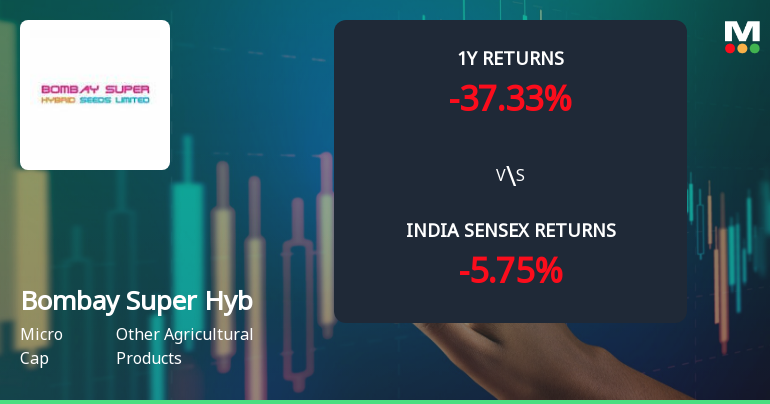
Consistent Underperformance against the benchmark over the last 3 years
Stock DNA
Other Agricultural Products
INR 902 Cr (Micro Cap)
34.00
35
0.00%
0.82
20.35%
6.81
Total Returns (Price + Dividend) 
Latest dividend: 0 per share ex-dividend date: Sep-19-2019
Risk Adjusted Returns v/s
Returns Beta

News
Bombay Super Hybrid Seeds Ltd Technical Momentum Shifts Amid Bearish Signals
Bombay Super Hybrid Seeds Ltd, a micro-cap player in the Other Agricultural Products sector, has experienced a subtle shift in its technical momentum, moving from a sideways trend to a mildly bearish stance. Despite a modest intraday price range between ₹83.20 and ₹89.00, the stock closed at ₹85.50, down 0.27% from the previous close of ₹86.40, signalling cautious investor sentiment amid mixed technical signals.
Read full news article
Bombay Super Hybrid Seeds Ltd Technical Momentum Shifts Amid Market Challenges
Bombay Super Hybrid Seeds Ltd, a micro-cap player in the Other Agricultural Products sector, has experienced a notable shift in its technical momentum, moving from a mildly bearish stance to a sideways trend. Despite this technical adjustment, the stock continues to face downward pressure, reflected in its recent price action and deteriorating relative strength compared to the broader market.
Read full news article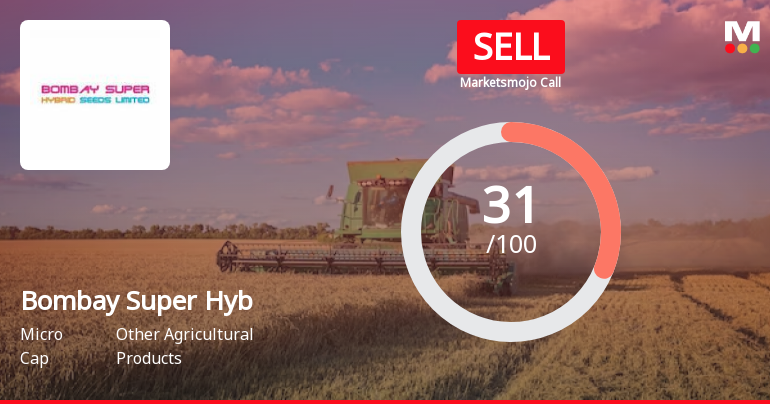
Bombay Super Hybrid Seeds Ltd is Rated Sell
Bombay Super Hybrid Seeds Ltd is rated Sell by MarketsMOJO, with this rating last updated on 06 Feb 2026. However, the analysis and financial metrics discussed here reflect the stock’s current position as of 20 July 2026, providing investors with an up-to-date view of the company’s fundamentals, returns, and market standing.
Read full news article Announcements
Bombay Super Hybrid Seeds Limited - Statement of deviation(s) or variation(s) under Reg. 32
21-Nov-2019 | Source : NSEBombay Super Hybrid Seeds Limited has informed the Exchange regarding Statement of deviation(s) or variation(s) under Reg. 32 of SEBI (LODR) Regulations 2015
Bombay Super Hybrid Seeds Limited - Outcome of Board Meeting
15-Nov-2019 | Source : NSEBombay Super Hybrid Seeds Limited has informed the Exchange regarding Board meeting held on November 14, 2019.
Corporate Actions

No Upcoming Board Meetings


Bombay Super Hybrid Seeds Ltd has announced 1:10 stock split, ex-date: 23 Sep 22

Bombay Super Hybrid Seeds Ltd has announced 1:3 bonus issue, ex-date: 27 Aug 20

No Rights history available
Quality key factors
Valuation key factors
Technicals key factors
 Technical Indicator Scale: Bearish, Mildly Bearish, Sideways, Mildly Bullish, Bullish Turned
 Shareholding Snapshot : Jun 2026
Shareholding Compare (%holding)
Promoters
None
Held by 0 Schemes
Held by 1 FIIs (0.0%)
Arvindkumar Jadavjibhai Kakadia (28.49%)
None
25.17%
Quarterly Results Snapshot (Standalone) - Mar'26 - QoQ

QoQ Growth in quarter ended Mar 2026 is -32.12% vs 264.51% in Dec 2025
QoQ Growth in quarter ended Mar 2026 is -43.02% vs 245.54% in Dec 2025
Half Yearly Results Snapshot (Standalone) - Sep'25
Growth in half year ended Sep 2025 is -2.81% vs 22.98% in Sep 2024

Growth in half year ended Sep 2025 is 10.01% vs 8.03% in Sep 2024
Nine Monthly Results Snapshot (Standalone) - Dec'25
YoY Growth in nine months ended Dec 2025 is -11.25% vs 37.96% in Dec 2024
YoY Growth in nine months ended Dec 2025 is 0.27% vs 16.24% in Dec 2024
Annual Results Snapshot (Standalone) - Mar'26
YoY Growth in year ended Mar 2026 is -4.09% vs 39.66% in Mar 2025
YoY Growth in year ended Mar 2026 is 0.95% vs 18.86% in Mar 2025
About Bombay Super Hybrid Seeds Ltd

Company Coordinates


