
Compare Bombay Super Hyb with Similar Stocks
Stock DNA
Other Agricultural Products
INR 960 Cr (Micro Cap)
36.00
35
0.00%
0.82
20.35%
7.73
Total Returns (Price + Dividend) 

Risk Adjusted Returns v/s
Returns Beta
News
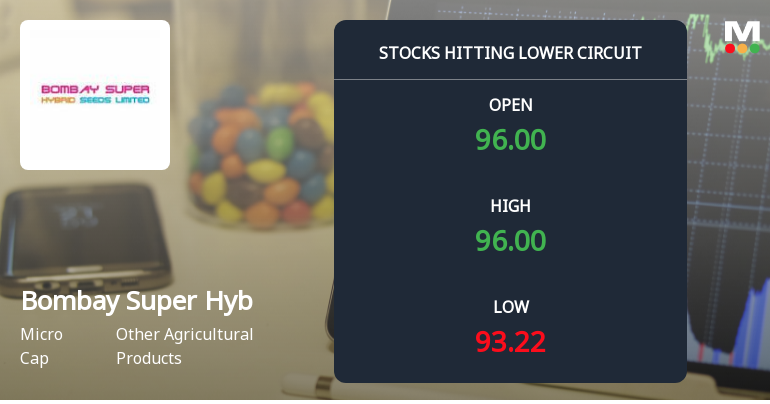
Below All Moving Averages and Now at Lower Circuit: Bombay Super Hybrid Seeds Ltd Loses 5% in a Single Session
At Rs 89.31, sellers were still queuing — but there were no buyers willing to take the other side. Bombay Super Hybrid Seeds Ltd locked at its lower circuit of 5% on 11 Jun 2026, with unfilled sell orders and a frozen price, signalling a pronounced imbalance in supply and demand.
Read full news article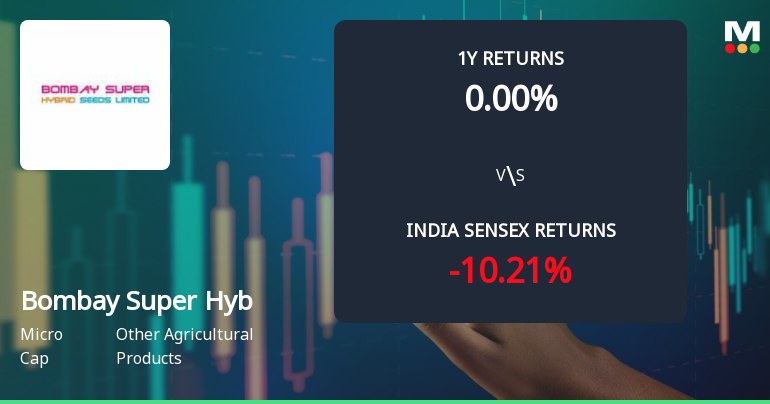
Bombay Super Hybrid Seeds Ltd Technical Momentum Shifts Amid Sideways Trend
Bombay Super Hybrid Seeds Ltd, a micro-cap player in the Other Agricultural Products sector, has exhibited a notable shift in its technical momentum, transitioning from a mildly bearish stance to a sideways trend. Despite a modest day decline of 1.05%, the stock’s technical indicators reveal nuanced signals that merit close attention from investors and market analysts alike.
Read full news article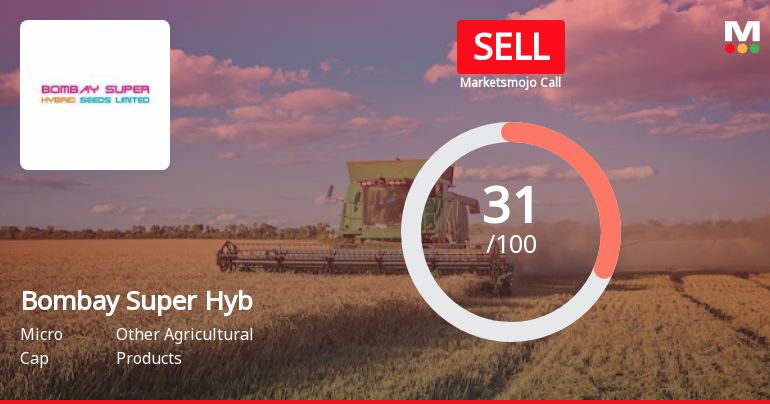
Bombay Super Hybrid Seeds Ltd is Rated Sell
Bombay Super Hybrid Seeds Ltd is rated 'Sell' by MarketsMOJO, with this rating last updated on 06 February 2026. However, the analysis and financial metrics discussed here reflect the stock's current position as of 08 June 2026, providing investors with an up-to-date view of the company’s fundamentals, valuation, financial trends, and technical outlook.
Read full news article Announcements
Announcement under Regulation 30 (LODR)-Newspaper Publication
27-May-2026 | Source : BSENewspaper Publication of Financial Statement for the Quarter and Year ended on March 31 2026.
Outcome Of The Board Meeting Held On May 25 2026 For Audited Financial Results And Other Business
25-May-2026 | Source : BSEPursuant to Regulations 30 and 33 of Chapter IV read with Schedule Il of the SEBI (Listing Obligations & Disclosure Requirements) Regulations 2015 we would like to inform the Exchange that Meeting of Board of Directors was held at registered office of the company situated at Shreenathiji Industrial Estate Plot No.11 National Highway 8-B Near Kuvadva GIDC Rajkot Gujarat: 360023 on today i.e. Monday May 25 2026. Following Business Transactions were considered and approved by the Board of Directors: (1) The Standalone Audited Financial Statements for the Quarter and Year ended on March 31 2026 along with Independent Auditors report thereupon; (2) Re-appointment of M/s H. H. Atkotiya & Associates Chartered Accountant (Firm Registration No. 127264W) as an Internal Auditor of the Company for the F.Y. 2026-27.
Board Meeting Outcome for Outcome Of The Board Meeting Held On May 25 2026
25-May-2026 | Source : BSE(1) The Standalone Audited Financial Statements for Quarter and Year ended 31st March 2026 (2) Appointment of Internal Auditor for FY 2026-27
Corporate Actions

No Upcoming Board Meetings


Bombay Super Hybrid Seeds Ltd has announced 1:10 stock split, ex-date: 23 Sep 22

Bombay Super Hybrid Seeds Ltd has announced 1:3 bonus issue, ex-date: 27 Aug 20

No Rights history available
Quality key factors
Valuation key factors
Technicals key factors
 Technical Indicator Scale: Bearish, Mildly Bearish, Sideways, Mildly Bullish, Bullish Turned
 Shareholding Snapshot : Apr 2018
Shareholding Compare (%holding)
Promoters
None
Held by 0 Schemes
Held by 0 FIIs
Arvindkumar Jadavjibhai Kakadia (28.49%)
None
0.62%
Quarterly Results Snapshot (Standalone) - Mar'26 - QoQ

QoQ Growth in quarter ended Mar 2026 is -32.12% vs 264.51% in Dec 2025
QoQ Growth in quarter ended Mar 2026 is -43.02% vs 245.54% in Dec 2025
Half Yearly Results Snapshot (Standalone) - Sep'25
Growth in half year ended Sep 2025 is -2.81% vs 22.98% in Sep 2024

Growth in half year ended Sep 2025 is 10.01% vs 8.03% in Sep 2024
Nine Monthly Results Snapshot (Standalone) - Dec'25
YoY Growth in nine months ended Dec 2025 is -11.25% vs 37.96% in Dec 2024
YoY Growth in nine months ended Dec 2025 is 0.27% vs 16.24% in Dec 2024
Annual Results Snapshot (Standalone) - Mar'26
YoY Growth in year ended Mar 2026 is -4.09% vs 39.66% in Mar 2025
YoY Growth in year ended Mar 2026 is 0.95% vs 18.86% in Mar 2025
About Bombay Super Hybrid Seeds Ltd

Company Coordinates


