
Compare Borana Weaves with Similar Stocks
Dashboard
Strong ability to service debt as the company has a low Debt to EBITDA ratio of 0.69 times
Healthy long term growth as Net Sales has grown by an annual rate of 42.10% and Operating profit at 49.67%
The company has declared Positive results for the last 3 consecutive quarters
With ROCE of 21.3, it has a Fair valuation with a 3.1 Enterprise value to Capital Employed
Falling Participation by Institutional Investors
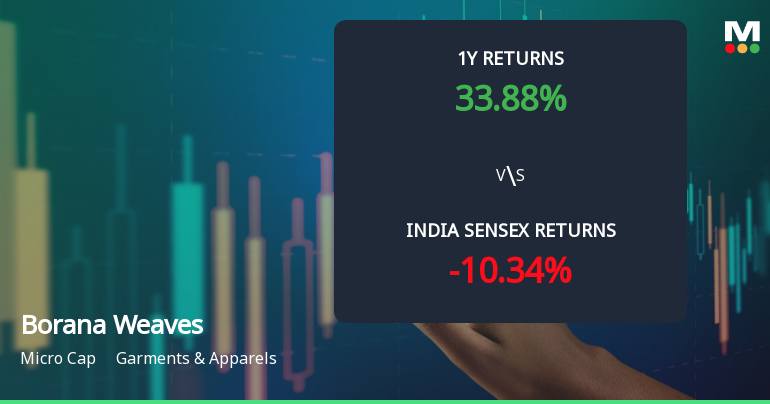
Market Beating Performance
Stock DNA
Garments & Apparels
INR 859 Cr (Micro Cap)
13.00
23
0.00%
0.16
26.29%
3.47
Total Returns (Price + Dividend) 
Borana Weaves for the last several years.
Risk Adjusted Returns v/s
Returns Beta

News
Borana Weaves Ltd Technical Momentum Shifts Amid Mixed Indicator Signals
Borana Weaves Ltd, a micro-cap player in the Garments & Apparels sector, has exhibited a notable shift in its technical momentum, moving from a sideways trend to a mildly bullish stance. This transition is underscored by mixed signals from key technical indicators such as MACD, RSI, moving averages, and Bollinger Bands, suggesting cautious optimism for investors amid a backdrop of strong relative returns versus the broader market.
Read full news article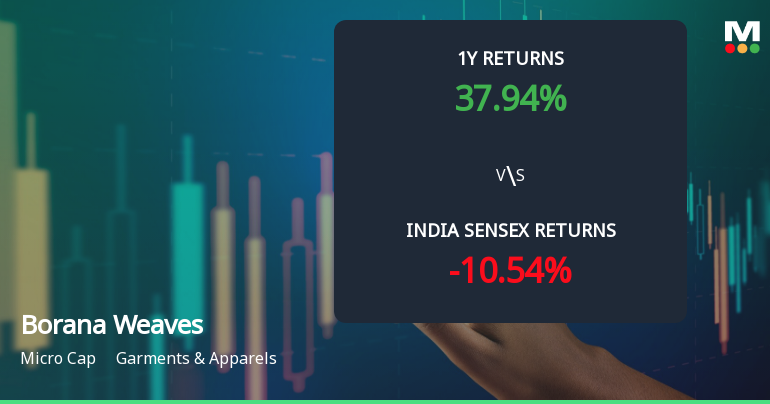
Borana Weaves Ltd Technical Momentum Shifts Amid Sideways Trend
Borana Weaves Ltd, a micro-cap player in the Garments & Apparels sector, has experienced a notable shift in its technical momentum, transitioning from a mildly bullish stance to a sideways trend. Recent technical indicators, including MACD, RSI, and moving averages, reveal a complex picture of price momentum that investors should carefully analyse amid broader market conditions.
Read full news article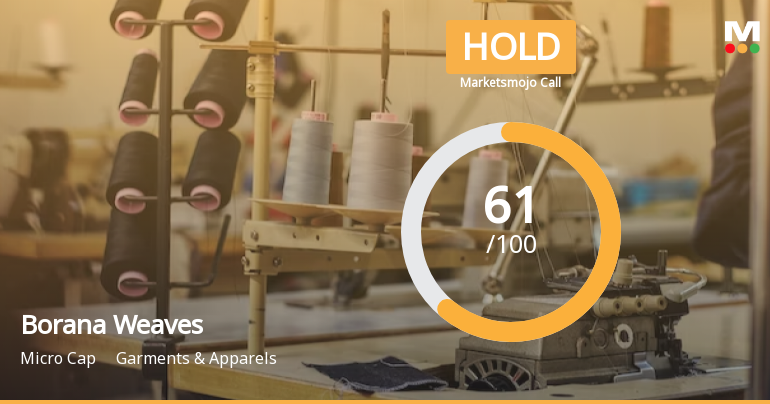
Borana Weaves Ltd is Rated Hold by MarketsMOJO
Borana Weaves Ltd is rated 'Hold' by MarketsMOJO, with this rating last updated on 19 Mar 2026. However, the analysis and financial metrics discussed here reflect the company’s current position as of 08 June 2026, providing investors with an up-to-date view of its fundamentals, returns, and market standing.
Read full news article Announcements
Announcement under Regulation 30 (LODR)-Investor Presentation
04-Jun-2026 | Source : BSEBorana Weaves Limited has informed the Exchange about Investor Presentation
Board Meeting Outcome for Outcome Of The Board Meeting Held On June 1 2026
01-Jun-2026 | Source : BSEOutcome of the Board Meeting held on June 1 2026
Submission Of Revised Financial Results For Year And Quarter Ended March 31 2026
28-May-2026 | Source : BSERevised Financial Results for the year and quarter ended March 31 2026
Corporate Actions

No Upcoming Board Meetings

No Dividend history available

No Splits history available

No Bonus history available

No Rights history available
Quality key factors
Valuation key factors
Technicals key factors
 Technical Indicator Scale: Bearish, Mildly Bearish, Sideways, Mildly Bullish, Bullish Turned
 Shareholding Snapshot : Mar 2026
Shareholding Compare (%holding)
Promoters
None
Held by 0 Schemes
Held by 11 FIIs (2.63%)
Mangilal Ambalal Borana (14.06%)
Nexus Equity Growth Fund - Nexus Equity Growth Fun (1.67%)
21.14%
Quarterly Results Snapshot (Standalone) - Mar'26 - QoQ

QoQ Growth in quarter ended Mar 2026 is -9.55% vs 16.61% in Dec 2025
QoQ Growth in quarter ended Mar 2026 is -7.22% vs 11.41% in Dec 2025
Half Yearly Results Snapshot (Standalone) - Sep'25
Not Applicable: The company has declared_date for only one period
Not Applicable: The company has declared_date for only one period
Nine Monthly Results Snapshot (Standalone) - Dec'25
Not Applicable: The company has declared_date for only one period
Not Applicable: The company has declared_date for only one period
Annual Results Snapshot (Standalone) - Mar'26
YoY Growth in year ended Mar 2026 is 33.85% vs 45.84% in Mar 2025
YoY Growth in year ended Mar 2026 is 60.72% vs 70.41% in Mar 2025
About Borana Weaves Ltd

Company Coordinates


