
Compare Borosil with Similar Stocks
Dashboard
Negative results in Mar 26
- PBT LESS OI(Q) At Rs 7.11 cr has Fallen at -65.7% (vs previous 4Q average)
- PAT(Q) At Rs 10.59 cr has Fallen at -45.8% (vs previous 4Q average)
- ROCE(HY) Lowest at 10.78%
With ROE of 8.8, it has a Expensive valuation with a 3.2 Price to Book Value
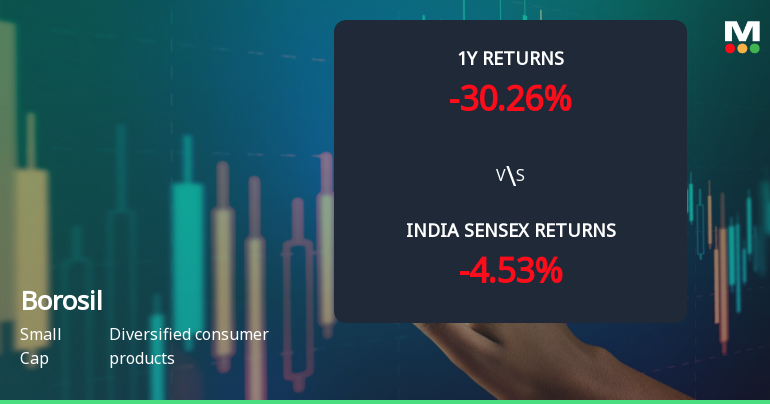
Consistent Underperformance against the benchmark over the last 3 years
Stock DNA
Diversified consumer products
INR 2,795 Cr (Small Cap)
36.00
36
0.00%
0.09
8.76%
3.13
Total Returns (Price + Dividend) 
Latest dividend: 0.8352093089527427 per share ex-dividend date: Aug-17-2021
Risk Adjusted Returns v/s
Returns Beta

News
Borosil Ltd Technical Momentum Shifts Amid Bearish Sentiment
Borosil Ltd, a small-cap player in the diversified consumer products sector, has experienced a notable shift in its technical momentum, reflecting a complex interplay of bearish and mildly bullish signals. Despite a modest 1.15% gain in the latest session, the stock’s overall trend remains under pressure, with key indicators signalling caution for investors.
Read full news article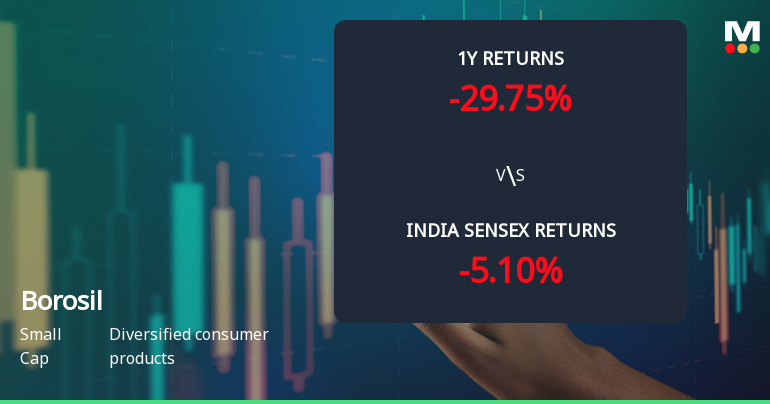
Borosil Ltd Faces Bearish Momentum Amid Technical Downgrade and Market Underperformance
Borosil Ltd, a small-cap player in the diversified consumer products sector, has experienced a notable shift in its technical momentum, with key indicators signalling a bearish trend. The stock’s recent price action, combined with deteriorating technical parameters, suggests mounting pressure amid broader market challenges and sectoral headwinds.
Read full news article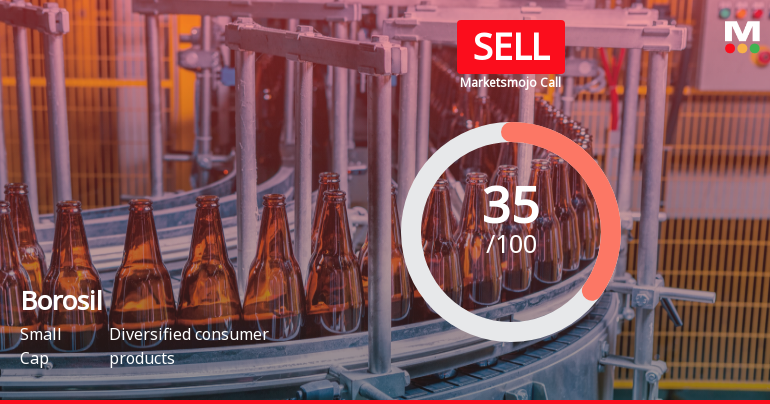
Borosil Ltd is Rated Sell by MarketsMOJO
Borosil Ltd is rated 'Sell' by MarketsMOJO, with this rating last updated on 14 Nov 2025. However, the analysis and financial metrics discussed here reflect the stock's current position as of 27 July 2026, providing investors with an up-to-date view of the company’s performance and outlook.
Read full news article Announcements
Announcement under Regulation 30 (LODR)-Change in Management
13-Jul-2026 | Source : BSEChange in Management - Appointment of Senior Management Personnel
Compliances-Certificate under Reg. 74 (5) of SEBI (DP) Regulations 2018
03-Jul-2026 | Source : BSECertificate under Regulation 74(5) of SEBI (Depositories and Participants) Regulations 2018 for the quarter ended June 30 2026
Disclosure Under Regulation 30 Of SEBI (LODR) Regulations 2015
01-Jul-2026 | Source : BSECommencement of commercial production from the manufacturing unit set up through the Companys Wholly Owned Subsidiary.
Corporate Actions

No Upcoming Board Meetings

Borosil Ltd has declared 100% dividend, ex-date: 17 Aug 21

No Splits history available

No Bonus history available

No Rights history available
Quality key factors
Valuation key factors
Technicals key factors
 Technical Indicator Scale: Bearish, Mildly Bearish, Sideways, Mildly Bullish, Bullish Turned
 Shareholding Snapshot : Jun 2026
Shareholding Compare (%holding)
Promoters
None
Held by 4 Schemes (3.48%)
Held by 28 FIIs (0.35%)
Kiran Kheruka (23.95%)
Dsp Small Cap Fund (3.43%)
21.68%
Quarterly Results Snapshot (Consolidated) - Mar'26 - QoQ

QoQ Growth in quarter ended Mar 2026 is -16.13% vs -0.47% in Dec 2025
QoQ Growth in quarter ended Mar 2026 is -55.78% vs 5.46% in Dec 2025
Half Yearly Results Snapshot (Consolidated) - Sep'25
Growth in half year ended Sep 2025 is 14.73% vs 21.55% in Sep 2024

Growth in half year ended Sep 2025 is 45.31% vs 17.54% in Sep 2024
Nine Monthly Results Snapshot (Consolidated) - Dec'25
YoY Growth in nine months ended Dec 2025 is 8.86% vs 17.20% in Dec 2024
YoY Growth in nine months ended Dec 2025 is 1.55% vs 3.78% in Dec 2024
Annual Results Snapshot (Consolidated) - Mar'26
YoY Growth in year ended Mar 2026 is 7.96% vs 16.79% in Mar 2025
YoY Growth in year ended Mar 2026 is 0.58% vs 12.69% in Mar 2025
About Borosil Ltd

Company Coordinates


