
Compare Borosil with Similar Stocks
Stock DNA
Diversified consumer products
INR 2,642 Cr (Small Cap)
34.00
36
0.00%
0.09
8.76%
2.94
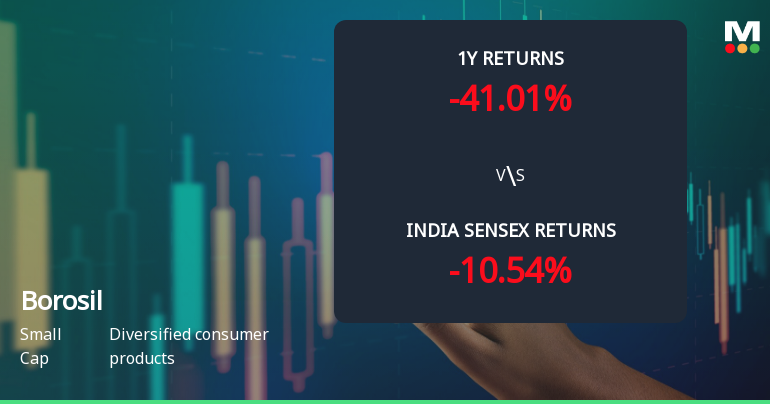
Total Returns (Price + Dividend) 
Latest dividend: 1 per share ex-dividend date: Aug-17-2021
Risk Adjusted Returns v/s
Returns Beta

News
Borosil Ltd Faces Bearish Momentum Amid Technical Indicator Shifts
Borosil Ltd, a small-cap player in the diversified consumer products sector, has experienced a notable shift in its technical momentum, moving from a mildly bearish to a more pronounced bearish trend. Recent technical indicators, including MACD, RSI, and moving averages, reveal a complex picture of weakening price momentum amid broader market pressures, signalling caution for investors.
Read full news article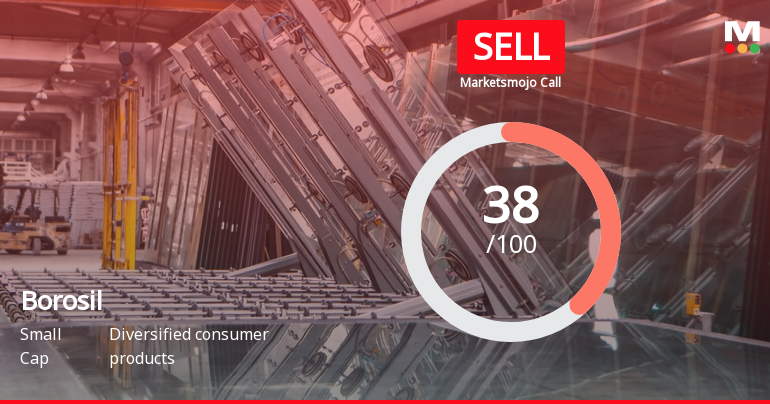
Borosil Ltd is Rated Sell by MarketsMOJO
Borosil Ltd is rated 'Sell' by MarketsMOJO, with this rating last updated on 14 Nov 2025. However, the analysis and financial metrics presented here reflect the company’s current position as of 02 June 2026, providing investors with an up-to-date view of the stock’s fundamentals, returns, and technical outlook.
Read full news article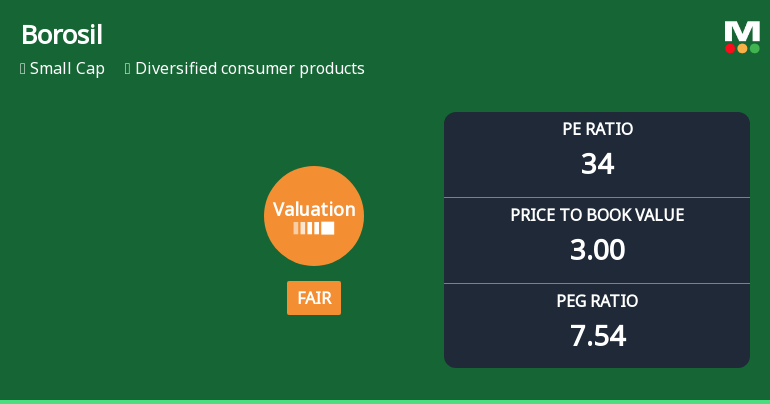
Borosil Ltd Valuation Shifts to Fair Amidst Challenging Market Returns
Borosil Ltd, a small-cap player in the diversified consumer products sector, has seen a notable shift in its valuation parameters, moving from an expensive rating to a fair valuation. Despite this improvement, the company continues to face headwinds in terms of returns and market performance, raising questions about its near-term attractiveness for investors.
Read full news article Announcements
Announcement under Regulation 30 (LODR)-Earnings Call Transcript
28-May-2026 | Source : BSETranscript of Earnings Call is enclosed
Compliances-Reg.24(A)-Annual Secretarial Compliance
22-May-2026 | Source : BSEAnnual Secretarial Compliance Report for the Financial Year ended March 31 2026.
Announcement under Regulation 30 (LODR)-Investor Presentation
22-May-2026 | Source : BSEInvestor Presentation is enclosed.
Corporate Actions

No Upcoming Board Meetings

Borosil Ltd has declared 100% dividend, ex-date: 17 Aug 21

No Splits history available

No Bonus history available

No Rights history available
Quality key factors
Valuation key factors
Technicals key factors
 Technical Indicator Scale: Bearish, Mildly Bearish, Sideways, Mildly Bullish, Bullish Turned
 Shareholding Snapshot : Mar 2026
Shareholding Compare (%holding)
Promoters
None
Held by 4 Schemes (3.48%)
Held by 25 FIIs (0.34%)
Kiran Kheruka (23.95%)
Dsp Small Cap Fund (3.43%)
21.73%
Quarterly Results Snapshot (Consolidated) - Mar'26 - QoQ

QoQ Growth in quarter ended Mar 2026 is -16.13% vs -0.47% in Dec 2025
QoQ Growth in quarter ended Mar 2026 is -55.78% vs 5.46% in Dec 2025
Half Yearly Results Snapshot (Consolidated) - Sep'25
Growth in half year ended Sep 2025 is 14.73% vs 21.55% in Sep 2024

Growth in half year ended Sep 2025 is 45.31% vs 17.54% in Sep 2024
Nine Monthly Results Snapshot (Consolidated) - Dec'25
YoY Growth in nine months ended Dec 2025 is 8.86% vs 17.20% in Dec 2024
YoY Growth in nine months ended Dec 2025 is 1.55% vs 3.78% in Dec 2024
Annual Results Snapshot (Consolidated) - Mar'26
YoY Growth in year ended Mar 2026 is 7.96% vs 16.79% in Mar 2025
YoY Growth in year ended Mar 2026 is 0.58% vs 12.69% in Mar 2025
About Borosil Ltd

Company Coordinates


