Borosil Renew.

  • Market Cap: Small Cap
  • Industry: Industrial Products
  • ISIN: INE666D01022
  • NSEID: BORORENEW
  • BSEID: 502219
INR
544.55
27.9 (5.4%)
BSENSE

Jun 12, 03:30 PM

BSE+NSE Vol: 13.22 lacs

  • Price Points
  • Score
  • Mojo Parameters
  • Total Return
  • News and Corporate Actions
  • Key factors
  • Shareholding
  • Financials
  • CompanyCV
stock-summaryPrice Point
High/Low

1Day

52 Week

Valuation
Technical
Day's Volume

CASH

13.22 lacs (43.41%) Volume

Shareholding (Mar 2026)

FII

4.27%

Held by 82 FIIs

DII

2.32%

Held by 1 DIIs

Promoter

58.77%

Why is Borosil Renewables Ltd falling/rising?

13-Jun-2026

As of 12-Jun, Borosil Renewables Ltd's stock price is rising to Rs 544.55, up 5.4%, supported by strong financial performance and positive sector trends. The stock has outperformed the Sensex and shows a bullish trend across various moving averages, despite a slight decline in delivery volume.

As of 12-Jun, Borosil Renewables Ltd's stock price is rising, currently at Rs 544.55, reflecting an increase of Rs 27.9 or 5.4%. This upward movement is supported by several factors. The stock has outperformed its sector by 2.52% today and reached an intraday high of Rs 545.95, marking a 5.67% increase. Additionally, the stock is trading above its 5-day, 20-day, 50-day, 100-day, and 200-day moving averages, indicating a strong bullish trend.<BR><BR>In terms of broader performance, the stock has shown a positive return of 3.84% over the past week, significantly outperforming the Sensex, which gained only 1.73%. Although the stock has experienced a slight decline of 0.54% over the past month, its year-to-date performance is positive at 0.81%, contrasting with the Sensex's decline of 11.37%. <BR><BR>The company has also demonstrated robust financial health, with a remarkable annual growth rate of 57.11% in operating profit and a staggering 431.1% growth in operating profit reported in March. Furthermore, Borosil Renewables Ltd has consistently declared positive results over the last three quarters, contributing to investor confidence. <BR><BR>Despite a slight decrease in delivery volume, which fell by 5.35% against the 5-day average, the stock remains liquid enough for trading, indicating ongoing interest from investors. Overall, the combination of strong financial results, positive sector performance, and favorable technical indicators contributes to the rising stock price of Borosil Renewables Ltd.

View full answer

How big is Borosil Renew.?

11-Jun-2026

As of 10th June, Borosil Renewables Ltd has a market capitalization of 7,453.00 Cr, with recent net sales of 1,555.84 Cr and a net profit of 129.08 Cr over the last four quarters.

As of 10th June, <BR><BR>Market Cap: Borosil Renewables Ltd has a market capitalization of 7,453.00 Cr, categorizing it as a Small Cap company.<BR><BR>Recent Quarterly Performance: The sum of Net Sales for the latest 4 quarters is 1,555.84 Cr, while the sum of Net Profit for the same period is 129.08 Cr.<BR><BR>Balance Sheet Snapshot: The reporting period for the latest annual data is March 2025. Shareholder's Funds are valued at 997.42 Cr, and Total Assets amount to 1,454.46 Cr.

View full answer

Who are in the management team of Borosil Renew.?

11-Jun-2026

The management team of Borosil Renew includes P K Kheruka (Chairman, Executive Director & CEO), V Ramaswami and Ashok Jain (Executive Directors), Shreevar Kheruka (Vice Chairman), and several independent non-executive directors. They oversee the company's strategic direction and operations.

The management team of Borosil Renew includes the following key members:<BR><BR>1. **P K Kheruka** - Chairman, Executive Director & CEO<BR>2. **V Ramaswami** - Executive Director & Wholetime Director<BR>3. **Ashok Jain** - Executive Director & Wholetime Director<BR>4. **Shreevar Kheruka** - Vice Chairman<BR>5. **Shalini Kamath** - Independent Non-Executive Director<BR>6. **Raj Kumar Jain** - Independent Non-Executive Director<BR>7. **P V Bhide** - Independent Non-Executive Director<BR>8. **Asif Syed Ibrahim** - Independent Non-Executive Director<BR>9. **Haigreve Khaitan** - Independent Non-Executive Director<BR>10. **Kishor Talreja** - Company Secretary & Compliance Officer<BR><BR>This team is responsible for guiding the company's strategic direction and overseeing its operations.

View full answer

Who are the peers of the Borosil Renew.?

11-Jun-2026

Borosil Renew.'s peers include Grindwell Norton, Carborundum Uni., SKF India, Prec. Wires (I), Apcotex Industri, Pix Transmission, and Belding India. Borosil Renew. has below-average management risk and a 1-year return of -10.54%, while Belding India leads with a 534.40% return.

Peers: The peers of Borosil Renew. are Grindwell Norton, Carborundum Uni., SKF India, Prec. Wires (I), Apcotex Industri, Pix Transmission, and Belding India.<BR><BR>Quality Snapshot: Excellent management risk is observed at SKF India and Apcotex Industri, while Good management risk is found at Grindwell Norton, Carborundum Uni., and the rest. Average management risk is present at Prec. Wires (I) and Pix Transmission, while Below Average management risk is noted for Borosil Renew. and Belding India. Growth is Excellent for Prec. Wires (I) and Borosil Renew., while Below Average growth is seen at Grindwell Norton, Carborundum Uni., Apcotex Industri, and the rest. Capital Structure is Excellent for Grindwell Norton, Carborundum Uni., SKF India, Apcotex Industri, and Pix Transmission, while Average capital structure is noted for Borosil Renew. and Good for Belding India.<BR><BR>Return Snapshot: The peer with the highest 1-year return is Belding India at 534.40%, while Borosil Renew. has a 1-year return of -10.54%, indicating a significantly lower performance. Prec. Wires (I) also shows a strong 1-year return of 114.21%. Additionally, peers with negative six-month returns include SKF India and Borosil Renew.

View full answer

Should I buy, sell or hold Borosil Renewables Ltd?

10-Jun-2026

What does Borosil Renew. do?

10-Jun-2026

Borosil Renewables Ltd, a small-cap company established in 1962, specializes in industrial products and reported net sales of 440 Cr and a net profit of 169 Cr for the quarter ending March 2026. The company has a market cap of INR 7,453 Cr and key metrics include a P/E of 22.00 and a return on equity of 22.72%.

Overview: <BR>Borosil Renewables Ltd operates in the Industrial Products sector and is categorized as a Small Cap company.<BR><BR>History: <BR>The company was established in 1962 and was originally known as Borosil Glass Works Limited. It changed its name to Borosil Renewables Limited on February 11, 2020. The latest quarterly results reported net sales and net profit for the period ending March 2026.<BR><BR>Financial Snapshot: <BR>Most recent Net Sales: 440 Cr (Quarterly Results - Mar 2026) <BR>Most recent Net Profit: 169 Cr (Quarterly Results - Mar 2026) <BR>Market-cap value: INR 7,453 Cr (Small Cap)<BR><BR>Key Metrics: <BR>P/E: 22.00 <BR>Industry P/E: 37 <BR>Dividend Yield: 0.00% <BR>Debt-Equity: -0.33 <BR>Return on Equity: 22.72% <BR>Price to Book: 5.00<BR><BR>Contact Details: <BR>Address: 1101 Crescenzo G-Block, Bandra Kurla Complex Bandra(E) Mumbai Maharashtra : 400051 <BR>Tel: 91-022-67406300 <BR>Email: investor.relations@borosil.com <BR>Website: http://www.borosilrenewables.com

View full answer

Are Borosil Renewables Ltd latest results good or bad?

13-May-2026

Borosil Renewables Ltd's latest Q4 FY25 results show a significant net profit increase to ₹169.14 crore and improved revenue, indicating a turnaround; however, the results were bolstered by a one-time tax benefit, and the company still faces challenges with low return metrics, suggesting cautious optimism for investors.

Borosil Renewables Ltd's latest results for Q4 FY25 present a mixed picture. On one hand, the company achieved a significant turnaround, reporting a net profit of ₹169.14 crore, which is a remarkable 68.97% increase quarter-over-quarter. This marks a return to profitability after a challenging period of losses in previous quarters. Additionally, revenue for the quarter reached ₹439.92 crore, reflecting a healthy growth of 12.67% from the previous quarter and 17.77% year-over-year.<BR><BR>The operating margin also improved significantly, reaching 31.0%, the highest quarterly margin in recent history, indicating better operational efficiency. However, it's important to note that this profit surge was largely aided by a one-time tax benefit, which raises questions about the sustainability of these results. Without this tax reversal, the normalized net profit would have been around ₹120 crore, still strong but substantially lower than the reported figure.<BR><BR>While the operational improvements are commendable, the company continues to face challenges with weak return metrics, such as an average return on equity (ROE) of just 4.29%, which is below industry standards. This suggests that despite the positive quarterly results, there are underlying concerns regarding capital efficiency and the overall sustainability of profitability.<BR><BR>In summary, while Borosil Renewables has shown strong operational improvements and a return to profitability, the reliance on one-time benefits and ongoing concerns about return metrics indicate that the results are not entirely unqualified good news. Investors should approach with cautious optimism, monitoring future performance to see if these improvements can be sustained.

View full answer

When is the next results date for Borosil Renewables Ltd?

06-May-2026

The next results date for Borosil Renewables Ltd is 12 May 2026.

The next results date for Borosil Renewables Ltd is scheduled for 12 May 2026.

View full answer

Is Borosil Renew. technically bullish or bearish?

20-Nov-2025

As of November 19, 2025, Borosil Renew's trend is mildly bullish, supported by bullish MACD and Bollinger Bands, but tempered by mixed signals from Dow Theory and weak momentum indicators like RSI.

As of 19 November 2025, the technical trend for Borosil Renew has changed from bullish to mildly bullish. The current stance is mildly bullish, supported by a bullish MACD on both weekly and monthly time frames, and mildly bullish Bollinger Bands on both time frames. The daily moving averages also indicate a mildly bullish trend. However, the Dow Theory shows a mixed signal with a mildly bearish weekly outlook, while the monthly perspective remains mildly bullish. The RSI shows no signal on both weekly and monthly charts, and the OBV indicates a bullish trend on the monthly but no trend on the weekly. Overall, the strength of the bullish stance is tempered by the mixed signals from Dow Theory and the lack of strong momentum indicators like RSI.

View full answer

How has been the historical performance of Borosil Renew.?

19-Nov-2025

Borosil Renew has experienced significant sales growth, increasing from 577.03 Cr in March 2016 to 1,479.33 Cr in March 2025, but has faced declining profitability, with profit before tax dropping from 101.06 Cr in March 2023 to -74.13 Cr by March 2025. Despite asset growth, the company struggles with cash flow stability and rising liabilities.

Answer:<BR>The historical performance of Borosil Renew has shown significant fluctuations over the years, particularly in net sales and profitability.<BR><BR>Breakdown:<BR>Borosil Renew's net sales have increased from 577.03 Cr in March 2016 to 1,479.33 Cr in March 2025, reflecting a strong upward trend. However, the company has faced challenges in profitability, with operating profit (PBDIT) peaking at 162.86 Cr in March 2023 but declining to 92.84 Cr by March 2025. The profit before tax has turned negative, dropping from 101.06 Cr in March 2023 to -74.13 Cr in March 2025, while profit after tax also fell from 70.66 Cr to -86.72 Cr in the same period. The company's total assets increased from 988.75 Cr in March 2017 to 1,454.46 Cr in March 2025, but total liabilities also rose, reaching 1,454.46 Cr in March 2025. Cash flow from operating activities improved to 99.00 Cr in March 2025, although the net cash outflow was -94.00 Cr, indicating ongoing financial pressures. Overall, while Borosil Renew has expanded its sales and asset base, it has struggled with profitability and cash flow stability in recent years.

View full answer

Is Borosil Renew. overvalued or undervalued?

13-Nov-2025

As of November 12, 2025, Borosil Renew. is considered very expensive and overvalued with a PE ratio of 233.48, despite outperforming the Sensex with a year-to-date return of 22.28%, indicating that its current price of 679.65 is not justified compared to its peers.

As of 12 November 2025, the valuation grade for Borosil Renew. has moved from risky to very expensive. The company is currently overvalued, with a PE ratio of 233.48, an EV to EBITDA ratio of 51.11, and a Price to Book Value of 10.67. These figures indicate a significant premium compared to its peers, such as Asahi India Glass, which has a PE ratio of 86.12, and Borosil, with a PE ratio of 46.98, both of which are considerably lower.<BR><BR>In terms of performance, Borosil Renew. has shown strong returns, outperforming the Sensex with a year-to-date return of 22.28% compared to the Sensex's 8.10%. However, despite this positive performance, the high valuation ratios suggest that the stock is not justified at its current price of 679.65, especially when compared to the more reasonable valuations of its peers.

View full answer

Who are the top shareholders of the Borosil Renew.?

17-Jul-2025

The top shareholder of Borosil Renew is the Pradeep Kumar Family Trust, holding 19.33%. Promoters own the majority of the company, with 80 Foreign Institutional Investors holding 4.54%, mutual funds accounting for 0.99%, and individual investors collectively owning 26.42%.

The top shareholders of Borosil Renew include the Pradeep Kumar Family Trust, which holds the highest stake at 19.33%. The company is primarily owned by its promoters, with no pledged promoter holdings reported. Additionally, there are 80 Foreign Institutional Investors (FIIs) holding about 4.54% of the shares, and mutual funds are represented by 9 schemes, accounting for 0.99%. Individual investors collectively hold 26.42% of the shares. There are no notable public shareholders listed.

View full answer

What is the bonus history of the Borosil Renew.?

06-Jun-2025

Borosil Renewables Ltd announced a 3:1 bonus issue on August 2, 2018, granting shareholders three additional shares for every one share held. The record date for this bonus was August 3, 2018.

Borosil Renewables Ltd has a bonus history that includes a significant issue announced on August 2, 2018. The company declared a 3:1 bonus issue, which means that for every one share held, shareholders received three additional shares. The record date for this bonus was August 3, 2018, and the ex-date was August 2, 2018. This was the latest bonus action recorded for the company.

View full answer

Has Borosil Renew. declared dividend?

06-Jun-2025

Borosil Renewables Ltd has declared a 65% dividend (0.65 per share) with an ex-date of December 18, 2019, but the dividend yield remains 0% as no dividends have been paid since then. Total returns show significant price appreciation over various periods, particularly in the long term.

Borosil Renewables Ltd has declared a 65% dividend.<BR><BR>Dividend Details:<BR>- Percentage announced: 65%<BR>- Amount per share: 0.65<BR>- Ex-date: 18 Dec 19<BR><BR>Dividend Yield: 0%<BR><BR>Total Returns by Period:<BR>In the 6 Months period, the price return was 2.65%, the dividend return was 0%, resulting in a total return of 2.65%.<BR><BR>In the 1 Year period, the price return was 19.7%, the dividend return was 0%, resulting in a total return of 19.7%.<BR><BR>In the 2 Years period, the price return was 6.35%, the dividend return was 0%, resulting in a total return of 6.35%.<BR><BR>In the 3 Years period, the price return was -15.57%, the dividend return was 0%, resulting in a total return of -15.57%.<BR><BR>In the 4 Years period, the price return was 109.08%, the dividend return was 0%, resulting in a total return of 109.08%.<BR><BR>In the 5 Years period, the price return was 783.76%, the dividend return was 0%, resulting in a total return of 783.76%.<BR><BR>Overall, while Borosil Renewables Ltd has declared a dividend, the dividend yield remains at 0%, indicating that there have been no dividends paid since the last declaration. The total returns over various periods show significant price appreciation, particularly over the longer term, despite the absence of recent dividend payments.

View full answer
iScoreScore
Click here to find our call on this stock
Strong Sell
Sell
Hold
Buy
Strong Buy

Dashboard

1

Poor Management Efficiency with a low ROE of 7.29%

  • The company has been able to generate a Return on Equity (avg) of 7.29% signifying low profitability per unit of shareholders funds
2

Healthy long term growth as Operating profit has grown by an annual rate 57.11%

 
3

With a growth in Operating Profit of 431.1%, the company declared Very Positive results in Mar 26

4

With ROE of 22.7, it has a Very Expensive valuation with a 5 Price to Book Value

5

Despite the size of the company, domestic mutual funds hold only 0.28% of the company

stock-summaryMojo Parameters

Mojo Parameters

Loading Valuation Snapshot...

Stock DNA

stock-summary
Industry

Industrial Products

stock-summary
Market cap

INR 7,449 Cr (Small Cap)

stock-summary
P/E

22.00

stock-summary
Industry P/E

36

stock-summary
Dividend Yield

0.00%

stock-summary
Debt Equity

-0.33

stock-summary
Return on Equity

22.72%

stock-summary
Price to Book

4.78

Revenue and Profits:
Net Sales:
440 Cr
(Quarterly Results - Mar 2026)
Net Profit:
169 Cr
stock-summaryTotal Returns
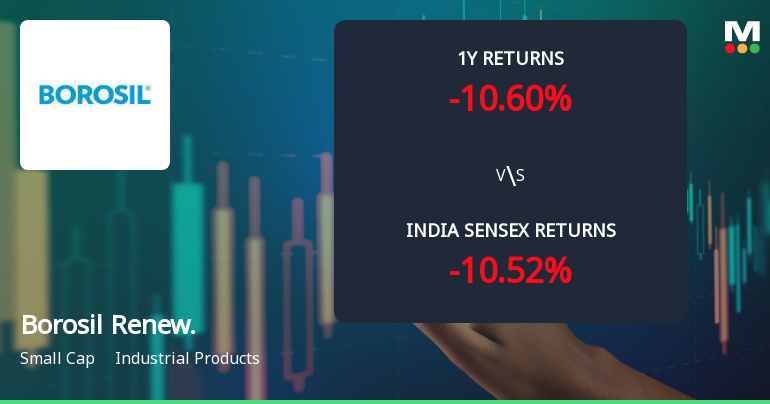
Total Returns (Price + Dividend) stock-summary
Dividend Yield (0%)
TimePeriod
Price Return
Dividend Return
Total Return
3 Months
28.96%
0%
28.96%
6 Months
-0.1%
0%
-0.1%
1 Year
-3.18%
0%
-3.18%
2 Years
9.25%
0%
9.25%
3 Years
1.71%
0%
1.71%
4 Years
-14.69%
0%
-14.69%
5 Years
95.07%
0%
95.07%

Latest dividend: 0.65 per share ex-dividend date: Dec-18-2019

Risk Adjusted Returns v/s stock-summary
Returns Beta
Icon
Beta has not been calculated since enough price history is not available
stock-summaryNews & Corporate Actions

Announcements stock-summary

Interview Of Mr. Pradeep Kumar Kheruka Executive Chairman Of The Company With NDTV Profit

03-Jun-2026 | Source : BSE

Interview of Mr. Pradeep Kumar Kheruka Executive Chairman of the Company with NDTV Profit

Imposition Of Countervailing Duty On Imports From Malaysia

03-Jun-2026 | Source : BSE

Imposition of Countervailing duty on imports from Malaysia

Announcement under Regulation 30 (LODR)-Newspaper Publication

03-Jun-2026 | Source : BSE

Newspaper Advertisement - Opening of Special window for transfer & demat of physical shares and Re-launch of IEPF Second 100 days campaign titled Saksham Niveshak

Corporate Actions stock-summary

stock-summary
BOARD MEETING

No Upcoming Board Meetings

stock-summary
DIVIDEND

Borosil Renewables Ltd has declared 65% dividend, ex-date: 18 Dec 19

stock-summary
SPLITS

Borosil Renewables Ltd has announced 1:10 stock split, ex-date: 14 Sep 17

stock-summary
BONUS

Borosil Renewables Ltd has announced 3:1 bonus issue, ex-date: 02 Aug 18

stock-summary
RIGHTS

No Rights history available

stock-summaryKey Factors

Quality key factors stock-summary

Factor
Value
Sales Growth (5y)
20.28%
EBIT Growth (5y)
57.11%
EBIT to Interest (avg)
7.18
Debt to EBITDA (avg)
4.78
Net Debt to Equity (avg)
-0.33
Sales to Capital Employed (avg)
0.91
Tax Ratio
10.55%
Dividend Payout Ratio
0
Pledged Shares
0
Institutional Holding
6.59%
ROCE (avg)
4.65%
ROE (avg)
7.29%

Valuation key factors

Factor
Value
P/E Ratio
22
Industry P/E
36
Price to Book Value
5.04
EV to EBIT
20.59
EV to EBITDA
16.14
EV to Capital Employed
6.99
EV to Sales
4.57
PEG Ratio
0.04
Dividend Yield
NA
ROCE (Latest)
33.95%
ROE (Latest)
22.72%

Technicals key factors

Indicator
Weekly
Monthly
MACD
Mildly Bullish
Bearish
RSI
No Signal
No Signal
Bollinger Bands
Bullish
Bullish
Moving Averages
Mildly Bearish (Daily)
KST
Bullish
Mildly Bearish
Dow Theory
No Trend
Mildly Bullish
OBV
Bullish
No Trend
stock-summary Technical Indicator Scale: Bearish, Mildly Bearish, Sideways, Mildly Bullish, Bullish  Turned 
stock-summaryShareholding
Shareholding Snapshot : Mar 2026stock-summary
Shareholding Compare (%holding) stock-summary
Majority shareholders

Promoters

Pledged Promoter Holdings

None

Mutual Funds

Held by 7 Schemes (0.12%)

FIIs

Held by 82 FIIs (4.27%)

Promoter with highest holding

Pradeep Kumar Family Trust (trustees- Kiran Kheruka Shreevar Kheruka & Rekha Kheruka) (18.27%)

Highest Public shareholder

None

Individual Investors Holdings

27.16%

stock-summaryFinancial
[
  {
    "link": "quarterly",
    "btn_text": "All Quarterly Results",
    "header": "Quarterly Results Snapshot (Consolidated) - Mar'26 - YoY",
    "rhs": [
      {
        "prefix": "Net Sales ",
        "suffix": "YoY Growth in quarter ended Mar 2026 is 17.77% vs 31.94% in Mar 2025",
        "dir": -1
      },
      {
        "prefix": "Consolidated Net Profit ",
        "suffix": "YoY Growth in quarter ended Mar 2026 is 941.49% vs 58.19% in Mar 2025",
        "dir": 1
      }
    ],
    "table": {
      "header": [
        "Mar'26",
        "Mar'25",
        "Change(%)"
      ],
      "body": [
        {
          "field": "Net Sales",
          "val1": "439.92",
          "val2": "373.54",
          "chgp": "17.77%",
          "chgp_class": "positive"
        },
        {
          "field": "Operating Profit (PBDIT) excl Other Income",
          "val1": "136.37",
          "val2": "15.45",
          "chgp": "782.65%",
          "chgp_class": "positive"
        },
        {
          "field": "Interest",
          "val1": "3.36",
          "val2": "9.54",
          "chgp": "-64.78%",
          "chgp_class": "positive"
        },
        {
          "field": "Exceptional Items",
          "val1": "0.00",
          "val2": "0.00",
          "chgp": "",
          "chgp_class": "neutral"
        },
        {
          "field": "Consolidate Net Profit",
          "val1": "169.14",
          "val2": "-20.10",
          "chgp": "941.49%",
          "chgp_class": "positive"
        },
        {
          "field": "Operating Profit Margin (Excl OI)",
          "val1": "31.00%",
          "val2": "4.14%",
          "chgp": "26.86%",
          "chgp_class": "positive"
        }
      ]
    }
  },
  {
    "link": "half-yearly",
    "btn_text": "All Half Yearly Results",
    "header": "Half Yearly Results Snapshot (Consolidated) - Sep'25",
    "rhs": [
      {
        "prefix": "Net Sales ",
        "suffix": " Growth in half year ended Sep 2025 is -2.53% vs -1.57% in Sep 2024",
        "dir": -1
      },
      {
        "prefix": "Consolidated Net Profit ",
        "suffix": " Growth in half year ended Sep 2025 is -516.90% vs -235.80% in Sep 2024",
        "dir": -1
      }
    ],
    "table": {
      "header": [
        "Sep'25",
        "Sep'24",
        "Change(%)"
      ],
      "body": [
        {
          "field": "Net Sales",
          "val1": "725.45",
          "val2": "744.30",
          "chgp": "-2.53%",
          "chgp_class": "negative"
        },
        {
          "field": "Operating Profit (PBDIT) excl Other Income",
          "val1": "181.60",
          "val2": "52.20",
          "chgp": "247.89%",
          "chgp_class": "positive"
        },
        {
          "field": "Interest",
          "val1": "7.81",
          "val2": "16.93",
          "chgp": "-53.87%",
          "chgp_class": "positive"
        },
        {
          "field": "Exceptional Items",
          "val1": "-230.06",
          "val2": "0.00",
          "chgp": "",
          "chgp_class": "neutral"
        },
        {
          "field": "Consolidate Net Profit",
          "val1": "-140.16",
          "val2": "-22.72",
          "chgp": "-516.90%",
          "chgp_class": "negative"
        },
        {
          "field": "Operating Profit Margin (Excl OI)",
          "val1": "25.03%",
          "val2": "7.01%",
          "chgp": "18.02%",
          "chgp_class": "positive"
        }
      ]
    }
  },
  {
    "link": "nine-monthly",
    "btn_text": "All Nine Monthly Results",
    "header": "Nine Monthly Results Snapshot (Consolidated) - Dec'25",
    "rhs": [
      {
        "prefix": "Net Sales ",
        "suffix": "YoY Growth in nine months ended Dec 2025 is 0.92% vs 1.81% in Dec 2024",
        "dir": -1
      },
      {
        "prefix": "Consolidated Net Profit ",
        "suffix": "YoY Growth in nine months ended Dec 2025 is 19.02% vs -4,328.21% in Dec 2024",
        "dir": 1
      }
    ],
    "table": {
      "header": [
        "Dec'25",
        "Dec'24",
        "Change(%)"
      ],
      "body": [
        {
          "field": "Net Sales",
          "val1": "1,115.91",
          "val2": "1,105.79",
          "chgp": "0.92%",
          "chgp_class": "positive"
        },
        {
          "field": "Operating Profit (PBDIT) excl Other Income",
          "val1": "304.64",
          "val2": "42.13",
          "chgp": "623.10%",
          "chgp_class": "positive"
        },
        {
          "field": "Interest",
          "val1": "10.82",
          "val2": "22.01",
          "chgp": "-50.84%",
          "chgp_class": "positive"
        },
        {
          "field": "Exceptional Items",
          "val1": "-213.40",
          "val2": "0.00",
          "chgp": "",
          "chgp_class": "neutral"
        },
        {
          "field": "Consolidate Net Profit",
          "val1": "-40.06",
          "val2": "-49.47",
          "chgp": "19.02%",
          "chgp_class": "positive"
        },
        {
          "field": "Operating Profit Margin (Excl OI)",
          "val1": "27.30%",
          "val2": "3.81%",
          "chgp": "23.49%",
          "chgp_class": "positive"
        }
      ]
    }
  },
  {
    "link": "annual",
    "btn_text": "All Annual Results",
    "header": "Annual Results Snapshot (Consolidated) - Mar'26",
    "rhs": [
      {
        "prefix": "Net Sales ",
        "suffix": "YoY Growth in year ended Mar 2026 is 5.17% vs 7.69% in Mar 2025",
        "dir": -1
      },
      {
        "prefix": "Consolidated Net Profit ",
        "suffix": "YoY Growth in year ended Mar 2026 is 285.54% vs -48.34% in Mar 2025",
        "dir": 1
      }
    ],
    "table": {
      "header": [
        "Mar'26",
        "Mar'25",
        "Change(%)"
      ],
      "body": [
        {
          "field": "Net Sales",
          "val1": "1,555.84",
          "val2": "1,479.33",
          "chgp": "5.17%",
          "chgp_class": "positive"
        },
        {
          "field": "Operating Profit (PBDIT) excl Other Income",
          "val1": "441.04",
          "val2": "57.59",
          "chgp": "665.83%",
          "chgp_class": "positive"
        },
        {
          "field": "Interest",
          "val1": "14.18",
          "val2": "31.55",
          "chgp": "-55.06%",
          "chgp_class": "positive"
        },
        {
          "field": "Exceptional Items",
          "val1": "-213.41",
          "val2": "0.00",
          "chgp": "",
          "chgp_class": "neutral"
        },
        {
          "field": "Consolidate Net Profit",
          "val1": "129.08",
          "val2": "-69.57",
          "chgp": "285.54%",
          "chgp_class": "positive"
        },
        {
          "field": "Operating Profit Margin (Excl OI)",
          "val1": "28.35%",
          "val2": "3.89%",
          "chgp": "24.46%",
          "chgp_class": "positive"
        }
      ]
    }
  }
]

Quarterly Results Snapshot (Consolidated) - Mar'26 - YoYstock-summary

Mar'26
Mar'25
Change(%)
Net Sales
439.92
373.54
17.77%
Operating Profit (PBDIT) excl Other Income
136.37
15.45
782.65%
Interest
3.36
9.54
-64.78%
Exceptional Items
0.00
0.00
Consolidate Net Profit
169.14
-20.10
941.49%
Operating Profit Margin (Excl OI)
31.00%
4.14%
26.86%
Values in Rs Cr.
Direction Arrows
Net Sales

YoY Growth in quarter ended Mar 2026 is 17.77% vs 31.94% in Mar 2025

Direction Arrows
Consolidated Net Profit

YoY Growth in quarter ended Mar 2026 is 941.49% vs 58.19% in Mar 2025

Half Yearly Results Snapshot (Consolidated) - Sep'25stock-summary

Sep'25
Sep'24
Change(%)
Net Sales
725.45
744.30
-2.53%
Operating Profit (PBDIT) excl Other Income
181.60
52.20
247.89%
Interest
7.81
16.93
-53.87%
Exceptional Items
-230.06
0.00
Consolidate Net Profit
-140.16
-22.72
-516.90%
Operating Profit Margin (Excl OI)
25.03%
7.01%
18.02%
Values in Rs Cr.
Direction Arrows
Net Sales

Growth in half year ended Sep 2025 is -2.53% vs -1.57% in Sep 2024

Direction Arrows
Consolidated Net Profit

Growth in half year ended Sep 2025 is -516.90% vs -235.80% in Sep 2024

Nine Monthly Results Snapshot (Consolidated) - Dec'25stock-summary

Dec'25
Dec'24
Change(%)
Net Sales
1,115.91
1,105.79
0.92%
Operating Profit (PBDIT) excl Other Income
304.64
42.13
623.10%
Interest
10.82
22.01
-50.84%
Exceptional Items
-213.40
0.00
Consolidate Net Profit
-40.06
-49.47
19.02%
Operating Profit Margin (Excl OI)
27.30%
3.81%
23.49%
Values in Rs Cr.
Direction Arrows
Net Sales

YoY Growth in nine months ended Dec 2025 is 0.92% vs 1.81% in Dec 2024

Direction Arrows
Consolidated Net Profit

YoY Growth in nine months ended Dec 2025 is 19.02% vs -4,328.21% in Dec 2024

Annual Results Snapshot (Consolidated) - Mar'26stock-summary

Mar'26
Mar'25
Change(%)
Net Sales
1,555.84
1,479.33
5.17%
Operating Profit (PBDIT) excl Other Income
441.04
57.59
665.83%
Interest
14.18
31.55
-55.06%
Exceptional Items
-213.41
0.00
Consolidate Net Profit
129.08
-69.57
285.54%
Operating Profit Margin (Excl OI)
28.35%
3.89%
24.46%
Values in Rs Cr.
Direction Arrows
Net Sales

YoY Growth in year ended Mar 2026 is 5.17% vs 7.69% in Mar 2025

Direction Arrows
Consolidated Net Profit

YoY Growth in year ended Mar 2026 is 285.54% vs -48.34% in Mar 2025

stock-summaryCompany CV
About Borosil Renewables Ltd stock-summary
stock-summary
Borosil Renewables Ltd
Small Cap
Industrial Products
Borosil Renewables Limited, formerly known as Borosil Glass Works Limited was established on December 14, 1962 mainly to acquire the undertaking of the Industrial and Engineering Apparatus Company Pvt. Ltd. The name of Company changed from Borosil Glass Works Limited to Borosil Renewables Limited on February 11, 2020 vide Certificate of Incorporation issued by the Registrar of Companies, Mumbai.
Company Coordinates stock-summary
Company Details
1101 Crescenzo G-Block, Bandra Kurla Complex Bandra(E) Mumbai Maharashtra : 400051
stock-summary
Tel: 91-022-67406300
stock-summary
investor.relations@borosil.com
Registrar Details
Mondkar Computers Pvt Ltd , 21 Shakil Niwas , Opp. Satya Saibaba Temple, Mahakali Caves Road, Andheri (E), Mumbai