
Compare Borosil Scienti. with Similar Stocks
Dashboard
Poor Management Efficiency with a low ROE of 4.53%
- The company has been able to generate a Return on Equity (avg) of 4.53% signifying low profitability per unit of shareholders funds
Poor long term growth as Net Sales has grown by an annual rate of 9.80% and Operating profit at 2.86% over the last 5 years
With ROE of 4.5, it has a Expensive valuation with a 2.2 Price to Book Value
Despite the size of the company, domestic mutual funds hold only 0.04% of the company
Underperformed the market in the last 1 year
Stock DNA
Industrial Products
INR 898 Cr (Micro Cap)
37.00
42
0.00%
-0.27
4.53%
2.22
Total Returns (Price + Dividend) 
Borosil Scienti. for the last several years.
Risk Adjusted Returns v/s
Returns Beta

News
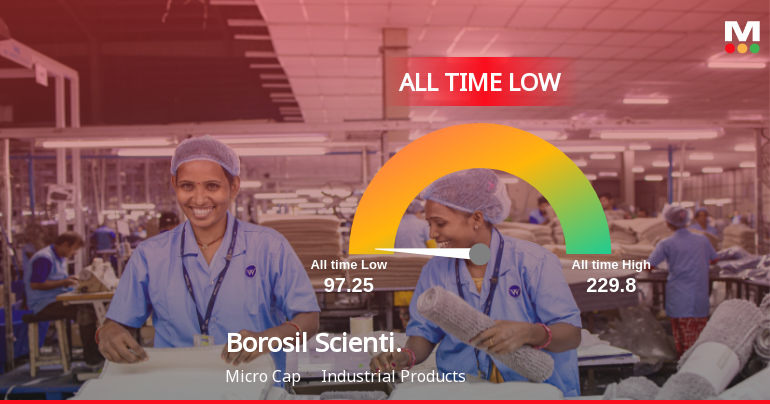
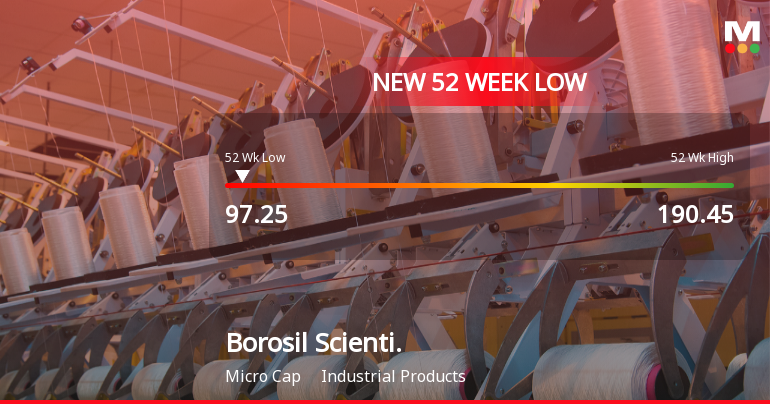
Borosil Scientific Ltd Falls to 52-Week Low of Rs 96.65 as Sell-Off Deepens
A sharp decline over the past two sessions has dragged Borosil Scientific Ltd to a fresh 52-week low of Rs 96.65 on 30 Mar 2026, marking a 3.82% drop in just two days despite the stock outperforming its sector marginally today.
Read full news article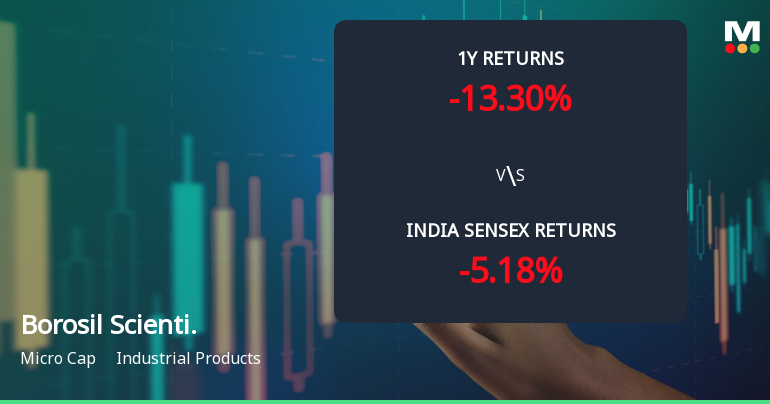
Borosil Scientific Ltd Faces Bearish Momentum Amid Technical Downturn
Borosil Scientific Ltd, a micro-cap player in the Industrial Products sector, has experienced a notable shift in its technical momentum, with key indicators signalling a bearish trend. The stock’s recent price action and technical parameters suggest increasing downside pressure, reflecting broader challenges in the company’s market performance compared to benchmark indices.
Read full news article Announcements
Closure of Trading Window
26-Mar-2026 | Source : BSEClosure of Trading Window
Announcement under Regulation 30 (LODR)-Investor Presentation
13-Feb-2026 | Source : BSEInvestor presentation for unaudited financial results for quarter and nine months ended December 31 2025
Financial Results For The Quarter And Nine Months Ended December 31 2025
11-Feb-2026 | Source : BSEFinancial Results for the quarter and nine months ended December 31 2025
Corporate Actions

No Upcoming Board Meetings

No Dividend history available

No Splits history available

No Bonus history available

No Rights history available
Quality key factors
Valuation key factors
Technicals key factors
 Technical Indicator Scale: Bearish, Mildly Bearish, Sideways, Mildly Bullish, Bullish Turned
 Shareholding Snapshot : Dec 2025
Shareholding Compare (%holding)
Promoters
None
Held by 1 Schemes (0.01%)
Held by 18 FIIs (0.07%)
Kiran Kheruka (25.52%)
Borosil Scientific Limited Unclaimed Securities Suspense Escrow Account (2.2%)
23.06%
Quarterly Results Snapshot (Consolidated) - Dec'25 - QoQ

QoQ Growth in quarter ended Dec 2025 is 13.47% vs 11.38% in Sep 2025
QoQ Growth in quarter ended Dec 2025 is 200.35% vs 169.47% in Sep 2025
Half Yearly Results Snapshot (Consolidated) - Sep'25

Growth in half year ended Sep 2025 is -1.90% vs 15.21% in Sep 2024
Growth in half year ended Sep 2025 is -109.18% vs 62.32% in Sep 2024
Nine Monthly Results Snapshot (Consolidated) - Dec'25
YoY Growth in nine months ended Dec 2025 is 5.16% vs 10.41% in Dec 2024
YoY Growth in nine months ended Dec 2025 is -59.13% vs 27.14% in Dec 2024
Annual Results Snapshot (Standalone) - Mar'25
YoY Growth in year ended Mar 2025 is 10.51% vs 9.00% in Mar 2024
YoY Growth in year ended Mar 2025 is 11.32% vs 3.25% in Mar 2024
About Borosil Scientific Ltd

Company Coordinates


