
Compare Brand Concepts with Similar Stocks
Stock DNA
Garments & Apparels
INR 256 Cr (Micro Cap)
135.00
48
0.00%
2.12
2.30%
3.00
Total Returns (Price + Dividend) 
Latest dividend: 0.5 per share ex-dividend date: Oct-19-2023
Risk Adjusted Returns v/s
Returns Beta

News
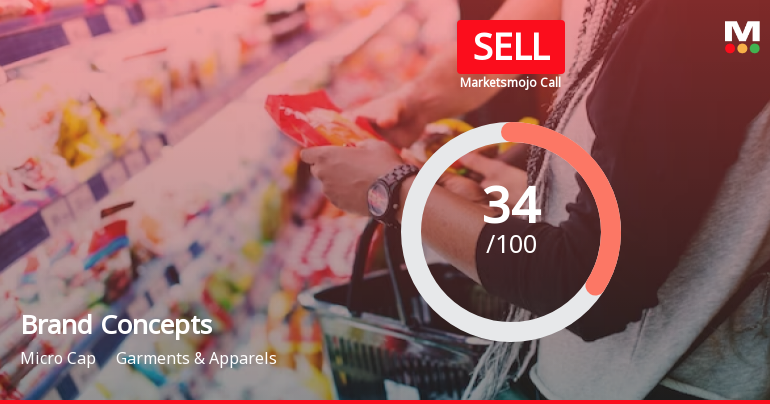
Brand Concepts Ltd is Rated Sell
Brand Concepts Ltd is rated Sell by MarketsMOJO, with this rating last updated on 20 May 2026. However, the analysis and financial metrics discussed here reflect the stock’s current position as of 07 July 2026, providing investors with an up-to-date view of the company’s fundamentals, returns, and market performance.
Read full news article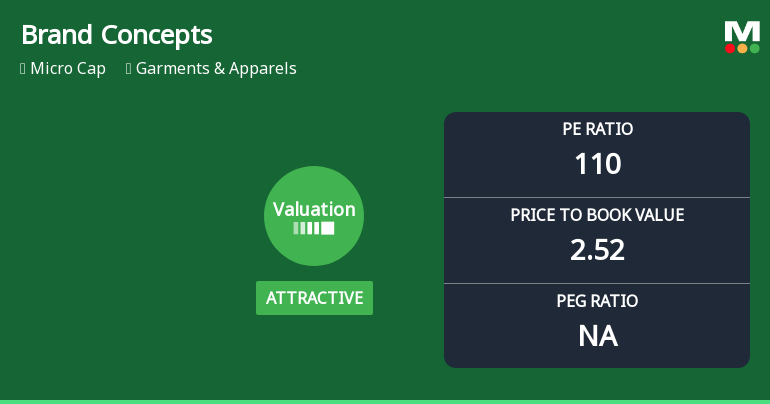
Brand Concepts Ltd Valuation Shifts to Attractive Amidst Challenging Market Returns
Brand Concepts Ltd, a micro-cap player in the Garments & Apparels sector, has witnessed a notable shift in its valuation parameters, moving from a fair to an attractive valuation grade despite ongoing market headwinds and a challenging earnings backdrop. This article analyses the recent changes in key valuation metrics such as price-to-earnings (P/E) and price-to-book value (P/BV) ratios, compares them with historical and peer averages, and assesses the implications for investors amid the company’s subdued price performance.
Read full news article
Brand Concepts Ltd is Rated Sell
Brand Concepts Ltd is rated Sell by MarketsMOJO, with this rating last updated on 20 May 2026. However, the analysis and financial metrics discussed below reflect the stock's current position as of 26 June 2026, providing investors with an up-to-date view of the company’s performance and outlook.
Read full news article Announcements
Brand Concepts Limited - Updates
03-Dec-2019 | Source : NSEBrand Concepts Limited has informed the Exchange regarding 'Opening of our New Store at Ambuja City Centre Mall, Raipur in the name of BAGLINE on 02nd December 2019'.
Brand Concepts Limited - Outcome of Board Meeting
14-Nov-2019 | Source : NSEBrand Concepts Limited has informed the Exchange regarding Board meeting held on November 14, 2019.
Brand Concepts Limited - Updates
16-Oct-2019 | Source : NSEBrand Concepts Limited has informed the Exchange regarding 'Opening of New Store at Seawood Grand Central Mall, Mumbai in the name of "BAGLINE"'.
Corporate Actions

No Upcoming Board Meetings

Brand Concepts Ltd has declared 5% dividend, ex-date: 19 Oct 23

No Splits history available

No Bonus history available

No Rights history available
Quality key factors
Valuation key factors
Technicals key factors
 Technical Indicator Scale: Bearish, Mildly Bearish, Sideways, Mildly Bullish, Bullish Turned
 Shareholding Snapshot : Jun 2026
Shareholding Compare (%holding)
Promoters
None
Held by 0 Schemes
Held by 1 FIIs (0.03%)
Prateek Maheshwari (24.04%)
Abhinav Kumar (8.06%)
42.64%
Quarterly Results Snapshot (Consolidated) - Mar'26 - YoY

YoY Growth in quarter ended Mar 2026 is 25.03% vs 8.51% in Mar 2025

YoY Growth in quarter ended Mar 2026 is -43.59% vs -19.59% in Mar 2025
Half Yearly Results Snapshot (Consolidated) - Sep'25
Growth in half year ended Sep 2025 is 9.83% vs 21.39% in Sep 2024
Growth in half year ended Sep 2025 is -108.78% vs -35.57% in Sep 2024
Nine Monthly Results Snapshot (Consolidated) - Dec'25
YoY Growth in nine months ended Dec 2025 is 13.95% vs 17.45% in Dec 2024
YoY Growth in nine months ended Dec 2025 is -94.99% vs -46.38% in Dec 2024
Annual Results Snapshot (Consolidated) - Mar'26
YoY Growth in year ended Mar 2026 is 19.23% vs 0.61% in Mar 2025
YoY Growth in year ended Mar 2026 is -79.16% vs -56.88% in Mar 2025
About Brand Concepts Ltd

Company Coordinates


