
Compare Brand Concepts with Similar Stocks
Stock DNA
Garments & Apparels
INR 234 Cr (Micro Cap)
117.00
46
0.00%
2.12
2.30%
2.81
Total Returns (Price + Dividend) 
Latest dividend: 0.5 per share ex-dividend date: Oct-19-2023
Risk Adjusted Returns v/s
Returns Beta

News

Brand Concepts Ltd is Rated Sell by MarketsMOJO
Brand Concepts Ltd is rated Sell by MarketsMOJO, with this rating last updated on 20 May 2026. However, the analysis and financial metrics discussed here reflect the stock’s current position as of 04 June 2026, providing investors with the latest insights into the company’s performance and outlook.
Read full news article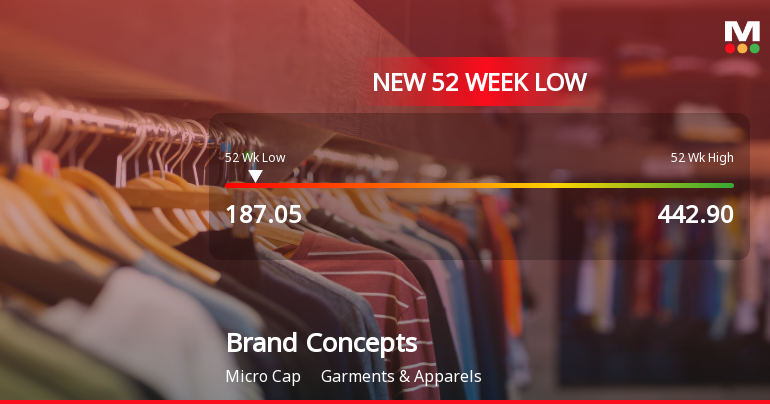
Markets Rally, But Brand Concepts Ltd Sinks to 52-Week Low in Stock-Specific Sell-Off
Despite a broadly steady market, Brand Concepts Ltd has plunged to a fresh 52-week low of Rs 187.05 on 27 May 2026, marking a 39.14% decline over the past year and underscoring persistent headwinds for the garment and apparel company.
Read full news article
Brand Concepts Ltd is Rated Sell by MarketsMOJO
Brand Concepts Ltd is rated Sell by MarketsMOJO, with this rating last updated on 20 May 2026. However, the analysis and financial metrics discussed here reflect the stock’s current position as of 24 May 2026, providing investors with the most recent and relevant data to assess the company’s outlook.
Read full news article Announcements
Announcement under Regulation 30 (LODR)-Investor Presentation
27-May-2026 | Source : BSEBrand Concepts Limited has informed the exchange about the Investor Presentation for the Quarter and Year ended 31.03.2026
Announcement under Regulation 30 (LODR)-Newspaper Publication
21-May-2026 | Source : BSEBrand Concepts Limited has informed the exchange about the Newspaper Publication of Audited Financial Results for the quarter and year ended 31.03.2026.
Filing Of Report Under Regulation 10(7) Of Securities And Exchange Board Of India (Substantial Acquisition Of Shares And Takeovers) Regulations 2011
21-May-2026 | Source : BSEBrand Concepts Limited has received a report from Mr. Prateek Maheshwari Member of Promoter group pursuant to Regulation 10(7) of SEBI (SAST) Regulations 2011 in relation to off market inter-se transfer by gift of 1624220 Equity shares of the Company from Mr. Pradeeep Maheshwari the promoter of the Company.
Corporate Actions

No Upcoming Board Meetings

Brand Concepts Ltd has declared 5% dividend, ex-date: 19 Oct 23

No Splits history available

No Bonus history available

No Rights history available
Quality key factors
Valuation key factors
Technicals key factors
 Technical Indicator Scale: Bearish, Mildly Bearish, Sideways, Mildly Bullish, Bullish Turned
 Shareholding Snapshot : Mar 2026
Shareholding Compare (%holding)
Promoters
None
Held by 0 Schemes
Held by 1 FIIs (0.0%)
Pradeep Maheshwari (19.78%)
Abhinav Kumar (8.06%)
42.56%
Quarterly Results Snapshot (Consolidated) - Mar'26 - YoY

YoY Growth in quarter ended Mar 2026 is 25.03% vs 8.51% in Mar 2025

YoY Growth in quarter ended Mar 2026 is -43.59% vs -19.59% in Mar 2025
Half Yearly Results Snapshot (Consolidated) - Sep'25
Growth in half year ended Sep 2025 is 9.83% vs 21.39% in Sep 2024
Growth in half year ended Sep 2025 is -108.78% vs -35.57% in Sep 2024
Nine Monthly Results Snapshot (Consolidated) - Dec'25
YoY Growth in nine months ended Dec 2025 is 13.95% vs 17.45% in Dec 2024
YoY Growth in nine months ended Dec 2025 is -94.99% vs -46.38% in Dec 2024
Annual Results Snapshot (Consolidated) - Mar'26
YoY Growth in year ended Mar 2026 is 19.23% vs 0.61% in Mar 2025
YoY Growth in year ended Mar 2026 is -79.16% vs -56.88% in Mar 2025
About Brand Concepts Ltd

Company Coordinates


