
Compare Brandman Retail with Similar Stocks
Dashboard
High Management Efficiency with a high ROCE of 0%
The company is Net-Debt Free
Poor long term growth as Operating profit has grown by an annual rate 0% of over the last 5 years
Flat results in Mar 26
With ROE of 17.8, it has a Very Attractive valuation with a 2.1 Price to Book Value
Stock DNA
Diversified Retail
INR 295 Cr (Micro Cap)
12.00
71
0.00%
-0.23
17.83%
1.98
Total Returns (Price + Dividend) 
Brandman Retail for the last several years.
Risk Adjusted Returns v/s
Returns Beta

News

Brandman Retail Ltd Locks at Lower Circuit With 5.0% Loss — Sellers Queue, No Buyers in Sight
At Rs 144.4, sellers were still queuing — but there were no buyers willing to take the other side. Brandman Retail Ltd locked at its lower circuit of 5.0% on 10 Jun 2026, with unfilled sell orders and a frozen price, reflecting persistent selling pressure in a micro-cap stock with limited liquidity.
Read full news article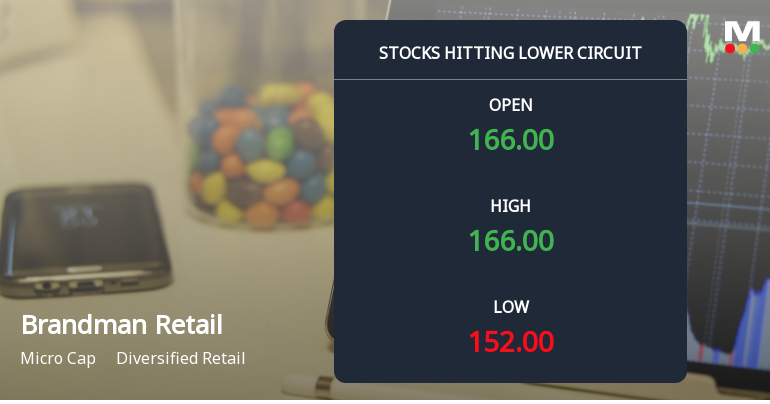
Brandman Retail Ltd Locks at Lower Circuit With 5.0% Loss — Sellers Queue, No Buyers in Sight
At Rs 152.0, sellers were still queuing — but there were no buyers willing to take the other side. Brandman Retail Ltd locked at its lower circuit of 5.0% on 8 Jun 2026, with unfilled sell orders and a frozen price.
Read full news article
Brandman Retail Ltd Locks at Upper Circuit With 5% Gain Amid Rising Delivery Volumes
At Rs 162.6, the buying was done — not because demand dried up, but because the exchange wouldn't let the stock go any higher. Brandman Retail Ltd locked at its upper circuit of 5% on 4 Jun 2026, with buyers queuing and no sellers willing to part with shares, signalling unfilled demand at the ceiling price.
Read full news article Announcements
Corporate Actions

No Upcoming Board Meetings

No Dividend history available

No Splits history available

No Bonus history available

No Rights history available
Quality key factors
Valuation key factors
Technicals key factors
 Technical Indicator Scale: Bearish, Mildly Bearish, Sideways, Mildly Bullish, Bullish Turned
 Shareholding Snapshot : Mar 2026
Shareholding Compare (%holding)
Promoters
None
Held by 0 Schemes
Held by 3 FIIs (1.76%)
Ms. Kavya Malhotra (69.44%)
Mr. Mukul Mahavir Agrawal (3.51%)
13.54%
Quarterly Results Snapshot (Standalone) - Mar'26 - QoQ

QoQ Growth in quarter ended Mar 2026 is 38.09% vs 72.12% in Dec 2025
QoQ Growth in quarter ended Mar 2026 is -63.11% vs 273.84% in Dec 2025
Half Yearly Results Snapshot (Standalone) - Mar'26
Not Applicable: The company has declared_date for only one period
Not Applicable: The company has declared_date for only one period
Nine Monthly Results Snapshot (Standalone) - Mar'26
Not Applicable: The company has declared_date for only one period
Not Applicable: The company has declared_date for only one period
Annual Results Snapshot (Consolidated) - Mar'26

YoY Growth in year ended Mar 2026 is 20.05% vs 9.70% in Mar 2025
YoY Growth in year ended Mar 2026 is 20.20% vs 154.41% in Mar 2025
About Brandman Retail Ltd

Company Coordinates


