
Compare Bridger Aerospace Group Holdings, Inc. with Similar Stocks
Dashboard
Weak Long Term Fundamental Strength with an average Return on Capital Employed (ROCE) of 0.81%
- Poor long term growth as Operating profit has grown by an annual rate 91.66% of over the last 5 years
- High Debt Company with a Debt to Equity ratio (avg) at times
With a growth in Net Sales of 96.54%, the company declared Outstanding results in Jun 25
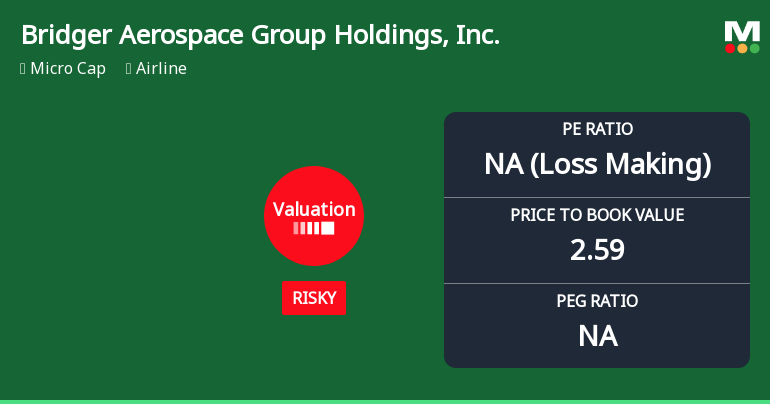
With ROE of -36.87%, it has a risky valuation with a 2.59 Price to Book Value
Consistent Underperformance against the benchmark over the last 3 years
Total Returns (Price + Dividend) 
Bridger Aerospace Group Holdings, Inc. for the last several years.
Risk Adjusted Returns v/s
News
Bridger Aerospace Group Holdings, Inc. Experiences Revision in Stock Evaluation Amidst Industry Challenges
Bridger Aerospace Group Holdings, Inc. has experienced a valuation adjustment amid challenging financial metrics, including a negative return on equity and low return on capital employed. Compared to peers, its performance lags significantly, with notable declines in stock value over the past year, highlighting competitive pressures in the airline industry.
Read full news article Announcements

Corporate Actions
Quality key factors
Valuation key factors
Technicals key factors
 Technical Indicator Scale: Bearish, Mildly Bearish, Sideways, Mildly Bullish, Bullish Turned
 Shareholding Snapshot : Mar 2025
Shareholding Compare (%holding)
Strategic Entities
Held in 8 Schemes (3.21%)
Held by 14 Foreign Institutions (0.8%)
Quarterly Results Snapshot (Consolidated) - Jun'25 - QoQ

QoQ Growth in quarter ended Jun 2025 is 97.44% vs 0.00% in Mar 2025
QoQ Growth in quarter ended Jun 2025 is 101.94% vs -21.09% in Mar 2025
Annual Results Snapshot (Consolidated) - Dec'24
YoY Growth in year ended Dec 2024 is 47.83% vs 43.75% in Dec 2023
YoY Growth in year ended Dec 2024 is 79.84% vs -83.85% in Dec 2023
About Bridger Aerospace Group Holdings, Inc.

Company Coordinates


