
Compare Brijlaxmi Leas. with Similar Stocks
Stock DNA
Non Banking Financial Company (NBFC)
INR 6 Cr (Micro Cap)
10.00
20
0.00%
3.02
9.72%
0.91
Total Returns (Price + Dividend) 
Brijlaxmi Leas. for the last several years.
Risk Adjusted Returns v/s
Returns Beta

News

Brijlaxmi Leasing & Finance Ltd Downgraded to Strong Sell Amid Technical Weakness and Flat Financials
Brijlaxmi Leasing & Finance Ltd, a micro-cap player in the Non Banking Financial Company (NBFC) sector, has seen its investment rating downgraded from Sell to Strong Sell as of 2 June 2026. This revision reflects a combination of deteriorating technical indicators, flat financial performance, and a reassessment of valuation metrics, signalling caution for investors amid a challenging market environment.
Read full news article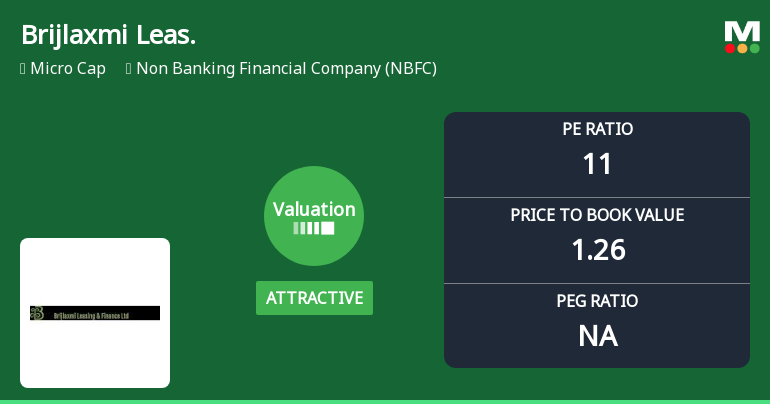
Brijlaxmi Leasing & Finance Ltd: Valuation Shift Enhances Price Attractiveness Amid Mixed Returns
Brijlaxmi Leasing & Finance Ltd, a micro-cap player in the Non Banking Financial Company (NBFC) sector, has witnessed a notable improvement in its valuation parameters, shifting from very attractive to attractive territory. Despite a mixed performance relative to the Sensex over various time frames, the stock’s current price multiples and return metrics suggest a recalibrated price attractiveness that merits close attention from investors.
Read full news articleAre Brijlaxmi Leasing & Finance Ltd latest results good or bad?
Brijlaxmi Leasing & Finance Ltd's latest financial results for the quarter ended March 2026 reveal significant operational challenges. The company reported net sales of ₹0.86 crores, reflecting an 82.05% decline year-on-year, which indicates a substantial drop from the previous year's revenue of ₹4.79 crores. This sharp decrease highlights fundamental issues in revenue generation that extend beyond typical market fluctuations. In terms of profitability, the net profit for the quarter was ₹0.03 crores, which represents a staggering 99.15% decline compared to the same quarter last year. The profit after tax (PAT) margin has also contracted dramatically from 74.11% in Q4 FY25 to just 3.49% in the latest quarter, illustrating severe compression in profitability metrics. Additionally, the operating profit margin (excluding other income) fell from 92.48% to 31.40%, further emphasizing the deterioration in operat...
Read full news article Announcements
Announcement under Regulation 30 (LODR)-Newspaper Publication
01-Jun-2026 | Source : BSENewspaper Advertisement of Audited Financial Result for the Forth Quater and Year ended 31st March 2026.
Non-Applicability Of Regulation 23(9) Of SEBI (LODR) Regulations 2015 Regarding Submission Of Disclosures Of Related Party Transactions For The Half Year Ended On March 31 2026
30-May-2026 | Source : BSEPlease find attached letter for Non Applicability of Regulation 23(9) of SEBI (LODR)
Board Meeting Outcome for Outcome Of The Board Meeting Held Today I.E. 30Th May 2026
30-May-2026 | Source : BSEPlease find attached Outcome of the Board Meeting held today i.e. 30th May 2026
Corporate Actions

No Upcoming Board Meetings

No Dividend history available

Brijlaxmi Leasing & Finance Ltd has announced 10:1 stock split, ex-date: 15 Nov 18

No Bonus history available

No Rights history available
Quality key factors
Valuation key factors
Technicals key factors
 Technical Indicator Scale: Bearish, Mildly Bearish, Sideways, Mildly Bullish, Bullish Turned
 Shareholding Snapshot : Mar 2026
Shareholding Compare (%holding)
Non Institution
None
Held by 0 Schemes
Held by 0 FIIs
Jaykishor Chaturvedi (7.8%)
Satya Securities Limited (3.49%)
63.8%
Quarterly Results Snapshot (Standalone) - Mar'26 - YoY

YoY Growth in quarter ended Mar 2026 is -82.05% vs 725.86% in Mar 2025
YoY Growth in quarter ended Mar 2026 is -99.15% vs 17,850.00% in Mar 2025
Half Yearly Results Snapshot (Standalone) - Sep'25

Growth in half year ended Sep 2025 is 15.24% vs -36.75% in Sep 2024
Growth in half year ended Sep 2025 is 134.07% vs -364.71% in Sep 2024
Nine Monthly Results Snapshot (Standalone) - Dec'25
YoY Growth in nine months ended Dec 2025 is 19.23% vs -39.77% in Dec 2024
YoY Growth in nine months ended Dec 2025 is 127.04% vs -351.28% in Dec 2024
Annual Results Snapshot (Standalone) - Mar'26
YoY Growth in year ended Mar 2026 is -55.21% vs 99.37% in Mar 2025
YoY Growth in year ended Mar 2026 is -58.23% vs 107.89% in Mar 2025
About Brijlaxmi Leasing & Finance Ltd


