
Compare Brilliant Port. with Similar Stocks
Stock DNA
Non Banking Financial Company (NBFC)
INR 3 Cr (Micro Cap)
5.00
24
0.00%
2.07
6.55%
0.29
Total Returns (Price + Dividend) 
Brilliant Port. for the last several years.
Risk Adjusted Returns v/s
Returns Beta

News
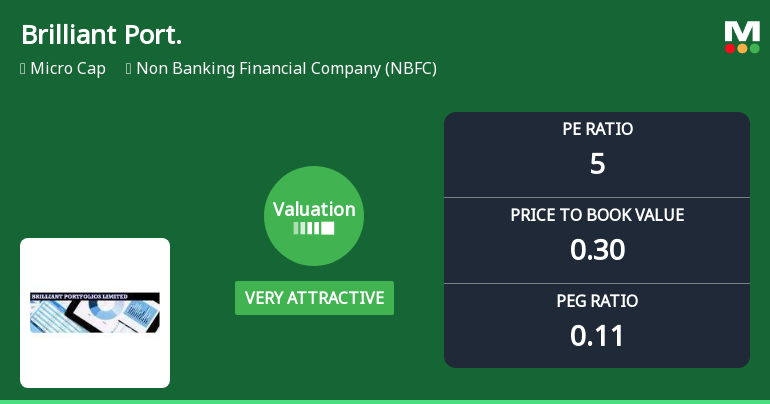
Brilliant Portfolios Ltd Valuation Shifts to Very Attractive Amid Market Outperformance
Brilliant Portfolios Ltd, a micro-cap player in the Non Banking Financial Company (NBFC) sector, has witnessed a significant shift in its valuation parameters, moving from a risky to a very attractive rating. This change comes alongside robust price appreciation and improved market sentiment, positioning the stock as a compelling value proposition relative to its peers and historical benchmarks.
Read full news article
Broad-Based Technical Strength Lifts Brilliant Portfolios Ltd to 52-Week High of Rs 9.32
With every major moving average breached to the upside and a strong 27.32% gain over the past year, Brilliant Portfolios Ltd surged to a fresh 52-week high of Rs 9.32 on 22 May 2026, outpacing the Sensex which declined 6.84% over the same period.
Read full news article Announcements
Compliances-Certificate under Reg. 74 (5) of SEBI (DP) Regulations 2018
07-Jul-2026 | Source : BSECertificate under Regulation 74 (5) of SEBI (DP) Regulations
Closure of Trading Window
26-Jun-2026 | Source : BSEClosure of Trading Window for Designated persons from 01st July 2026 to 48 hours of declaration of unaudited financial results for the Quarter ending 30th June 2026
Announcement under Regulation 30 (LODR)-Newspaper Publication
30-May-2026 | Source : BSESubmission of Publish Audited Financial results of the period ended 31st March 2026
Corporate Actions

No Upcoming Board Meetings

No Dividend history available

No Splits history available

No Bonus history available

No Rights history available
Quality key factors
Valuation key factors
Technicals key factors
 Technical Indicator Scale: Bearish, Mildly Bearish, Sideways, Mildly Bullish, Bullish Turned
 Shareholding Snapshot : Jun 2026
Shareholding Compare (%holding)
Promoters
None
Held by 0 Schemes
Held by 0 FIIs
Sarita Jain (9.78%)
Anil Gupta (3.22%)
47.21%
Quarterly Results Snapshot (Standalone) - Mar'26 - YoY

YoY Growth in quarter ended Mar 2026 is 17.98% vs 9.88% in Mar 2025

YoY Growth in quarter ended Mar 2026 is 50.00% vs 1,700.00% in Mar 2025
Half Yearly Results Snapshot (Standalone) - Sep'25
Growth in half year ended Sep 2025 is -5.73% vs 6.08% in Sep 2024
Growth in half year ended Sep 2025 is 8.00% vs -30.56% in Sep 2024
Nine Monthly Results Snapshot (Standalone) - Dec'25
YoY Growth in nine months ended Dec 2025 is -5.63% vs 3.59% in Dec 2024
YoY Growth in nine months ended Dec 2025 is 2.70% vs -24.49% in Dec 2024
Annual Results Snapshot (Standalone) - Mar'26
YoY Growth in year ended Mar 2026 is 0.94% vs 4.92% in Mar 2025
YoY Growth in year ended Mar 2026 is 16.36% vs 10.00% in Mar 2025
About Brilliant Portfolios Ltd

Company Coordinates


