
Compare Calcom Vision with Similar Stocks
Stock DNA
Electronics & Appliances
INR 112 Cr (Micro Cap)
71.00
54
0.00%
0.65
1.86%
1.30
Total Returns (Price + Dividend) 
Calcom Vision for the last several years.
Risk Adjusted Returns v/s
Returns Beta

News

Calcom Vision Ltd is Rated Strong Sell
Calcom Vision Ltd is rated Strong Sell by MarketsMOJO, with this rating last updated on 01 June 2026. However, all fundamentals, returns, and financial metrics discussed here reflect the company’s current position as of 02 June 2026, providing investors with the most up-to-date analysis.
Read full news article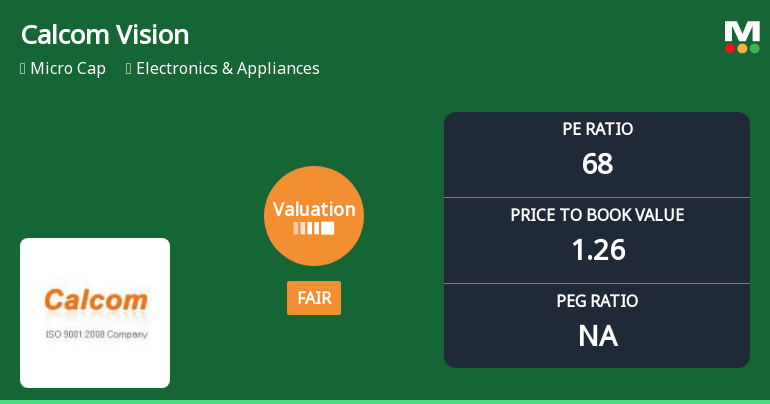
Calcom Vision Ltd Valuation Shifts Amid Market Downturn
Calcom Vision Ltd, a micro-cap player in the Electronics & Appliances sector, has witnessed a notable shift in its valuation parameters, moving from an attractive to a fair rating. This change comes amid a significant decline in its share price and deteriorating market sentiment, raising questions about its price attractiveness relative to peers and historical benchmarks.
Read full news article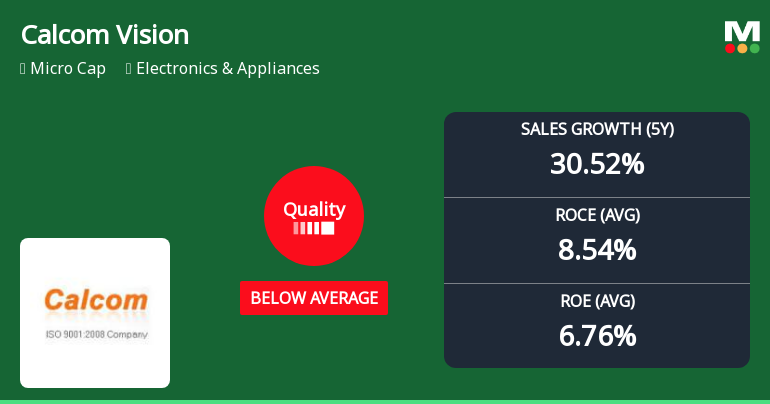
Calcom Vision Ltd Downgraded to Strong Sell as Quality Parameters Deteriorate
Calcom Vision Ltd, a micro-cap player in the Electronics & Appliances sector, has seen its quality grading slip from average to below average, prompting a downgrade to a Strong Sell rating by MarketsMOJO as of 29 April 2026. This shift reflects a notable deterioration in key business fundamentals including return ratios, debt levels, and operational consistency, raising concerns about the company’s near-term prospects amid a challenging market environment.
Read full news article Announcements
Announcement under Regulation 30 (LODR)-Newspaper Publication
01-Jun-2026 | Source : BSENews Paper Publication of Quarterly and Annual Results for 31st March 2026
Announcement under Regulation 30 (LODR)-Investor Presentation
01-Jun-2026 | Source : BSEInvestor Presentation for the quarter and year ended 31st March 2026
Compliances-Reg.24(A)-Annual Secretarial Compliance
30-May-2026 | Source : BSECompliance Report March 2026
Corporate Actions

No Upcoming Board Meetings

No Dividend history available

No Splits history available

No Bonus history available

No Rights history available
Quality key factors
Valuation key factors
Technicals key factors
 Technical Indicator Scale: Bearish, Mildly Bearish, Sideways, Mildly Bullish, Bullish Turned
 Shareholding Snapshot : Mar 2026
Shareholding Compare (%holding)
Promoters
None
Held by 3 Schemes (0.05%)
Held by 2 FIIs (7.28%)
Prudent Infrastructures Private Limited (26.04%)
Massachusetts Institute Of Technology (6.55%)
21.49%
Quarterly Results Snapshot (Consolidated) - Mar'26 - QoQ

QoQ Growth in quarter ended Mar 2026 is 23.42% vs 10.13% in Dec 2025
QoQ Growth in quarter ended Mar 2026 is 91.58% vs -147.98% in Dec 2025
Half Yearly Results Snapshot (Consolidated) - Sep'25
Growth in half year ended Sep 2025 is 81.74% vs -27.54% in Sep 2024
Growth in half year ended Sep 2025 is 1,405.00% vs -142.55% in Sep 2024
Nine Monthly Results Snapshot (Consolidated) - Dec'25
YoY Growth in nine months ended Dec 2025 is 54.90% vs -14.25% in Dec 2024
YoY Growth in nine months ended Dec 2025 is 5,433.33% vs -94.12% in Dec 2024
Annual Results Snapshot (Consolidated) - Mar'26
YoY Growth in year ended Mar 2026 is 38.82% vs -1.84% in Mar 2025
YoY Growth in year ended Mar 2026 is 41.07% vs -12.50% in Mar 2025
About Calcom Vision Ltd

Company Coordinates


