
Compare Callista Indus. with Similar Stocks
Total Returns (Price + Dividend) 
Callista Indus. for the last several years.
Risk Adjusted Returns v/s
Returns Beta

News
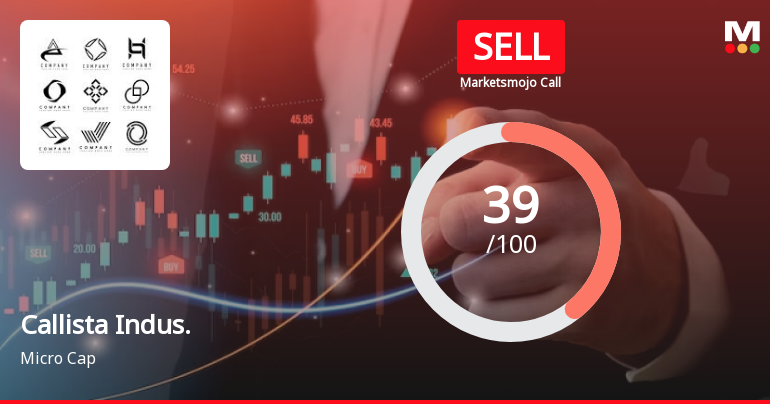
Callista Industries Ltd is Rated Sell
Callista Industries Ltd is rated Sell by MarketsMOJO. This rating was last updated on 06 May 2026, reflecting a shift from a previous 'Strong Sell' stance. However, the analysis and financial metrics presented here are based on the stock's current position as of 18 June 2026, providing investors with the latest insights into the company’s performance and outlook.
Read full news article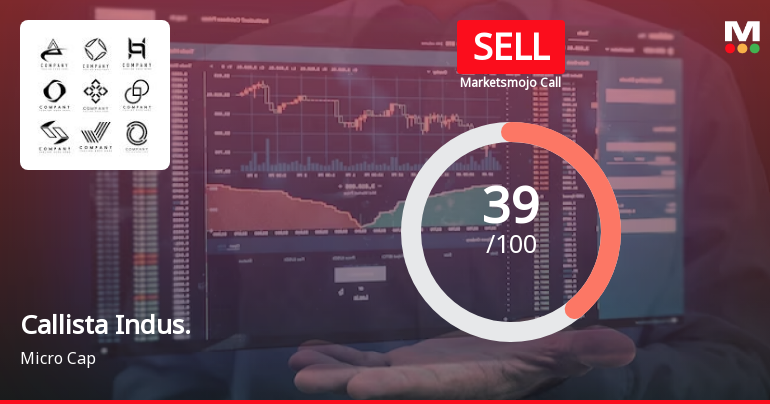
Callista Industries Ltd is Rated Sell by MarketsMOJO
Callista Industries Ltd is rated 'Sell' by MarketsMOJO, with this rating last updated on 06 May 2026. However, the analysis and financial metrics discussed here reflect the stock's current position as of 04 June 2026, providing investors with the latest insights into the company’s performance and outlook.
Read full news article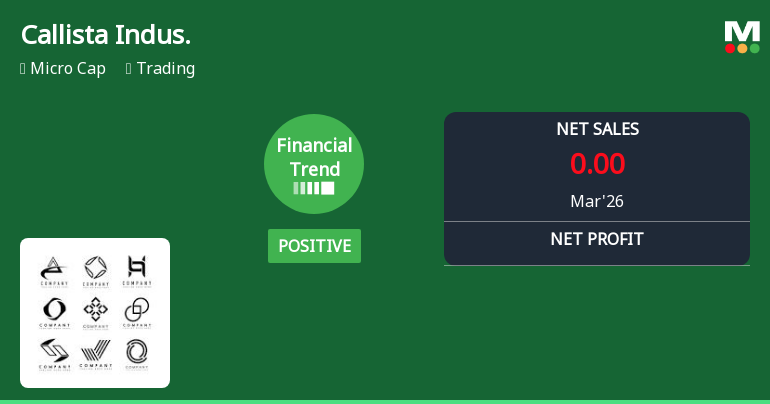
Callista Industries Ltd Reports Positive Quarterly Turnaround Amid Micro-Cap Challenges
Callista Industries Ltd has demonstrated a notable financial turnaround in the quarter ended March 2026, shifting from a flat to a positive growth trajectory. Despite its micro-cap status and a recent downgrade in its Mojo Grade to Sell, the company posted its highest quarterly profit after tax and earnings per share in recent history, signalling potential early recovery signs amid a challenging market environment.
Read full news article Announcements
Announcement under Regulation 30 (LODR)-Allotment
24-Jun-2026 | Source : BSEPlease find the attached Outcome of Board Meeting for the Meeting held on 24.06.2026 for Allotment of Equity Shares and Convertibel Warrants.
Disclosures under Reg. 29(1) of SEBI (SAST) Regulations 2011
24-Jun-2026 | Source : BSEThe Exchange has received the disclosure under Regulation 29(1) of SEBI (Substantial Acquisition of Shares & Takeovers) Regulations 2011 for Koriander Consultants LLP
Board Meeting Outcome for Meeting Held On 24Th June 2026
24-Jun-2026 | Source : BSEPlease find the attached Outcome of Board Meeting for Allotment of Equity Shares and Convertible Warrants.
Corporate Actions

No Upcoming Board Meetings

No Dividend history available

No Splits history available

No Bonus history available

No Rights history available
Quality key factors
Valuation key factors
Technicals key factors
 Technical Indicator Scale: Bearish, Mildly Bearish, Sideways, Mildly Bullish, Bullish Turned
 Shareholding Snapshot : Jun 2026
Shareholding Compare (%holding)
Non Institution
None
Held by 0 Schemes
Held by 0 FIIs
Rashmi Ravi Sharma (14.3%)
Koriander Consultants Llp (24.71%)
30.61%
Quarterly Results Snapshot (Standalone) - Mar'26 - QoQ
QoQ Growth in quarter ended Mar 2026 is 0.00% vs 0.00% in Dec 2025

QoQ Growth in quarter ended Mar 2026 is 216.67% vs -860.00% in Dec 2025
Half Yearly Results Snapshot (Standalone) - Sep'25
Growth in half year ended Sep 2025 is 0.00% vs 0.00% in Sep 2024

Growth in half year ended Sep 2025 is -700.00% vs 92.86% in Sep 2024
Nine Monthly Results Snapshot (Standalone) - Dec'25
YoY Growth in nine months ended Dec 2025 is 0.00% vs 0.00% in Dec 2024
YoY Growth in nine months ended Dec 2025 is -1,300.00% vs 73.33% in Dec 2024
Annual Results Snapshot (Standalone) - Mar'26
YoY Growth in year ended Mar 2026 is 0.00% vs 0.00% in Mar 2025
YoY Growth in year ended Mar 2026 is 100.00% vs -320.00% in Mar 2025
About Callista Industries Ltd

Company Coordinates


