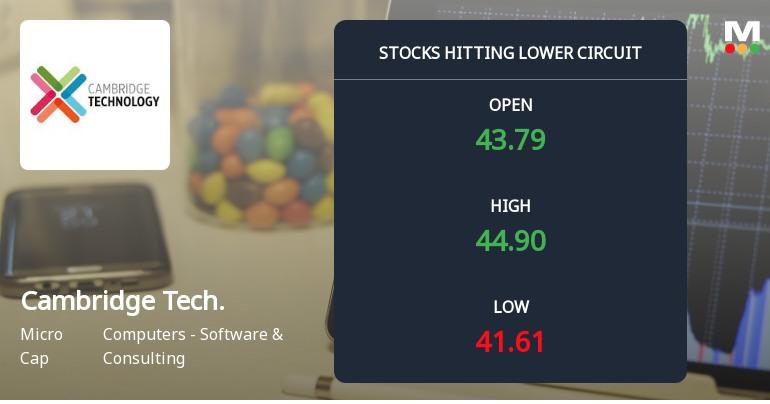
Cambridge Tech.

  • Market Cap: Micro Cap
  • Industry: Computers - Software & Consulting
  • ISIN: INE627H01017
  • NSEID: CTE
  • BSEID: 532801
INR
40.70
1.05 (2.65%)
BSENSE

Sep 16, 03:30 PM

BSE+NSE Vol: 5.62 k

  • Price Points
  • Score
  • Mojo Parameters
  • Total Return
  • News and Corporate Actions
  • Key factors
  • Shareholding
  • Financials
  • CompanyCV
stock-summaryPrice Point
High/Low

1Day

52 Week

Valuation
Technical
Day's Volume

CASH

5.62 k (-53.60%) Volume

Shareholding (Jun 2026)

FII

0.00%

Held by 0 FIIs

DII

0.00%

Held by 0 DIIs

Promoter

57.13%

Why is Cambridge Technology Enterprises Ltd falling/rising?

06-Sep-2026

As of 05-Sep, the stock price of Cambridge Technology Enterprises Ltd is rising to 42.05, reflecting a trend reversal after previous declines and outperforming its sector. Increased investor participation and strong short-term positioning contribute to this upward movement.

As of 05-Sep, the stock price of Cambridge Technology Enterprises Ltd is rising, currently at 42.05, with a change of 0.44 (1.06%) upwards. This increase can be attributed to several factors. Firstly, the stock has experienced a trend reversal, gaining after four consecutive days of decline, indicating a potential shift in market sentiment. Additionally, the stock has outperformed its sector by 2.33% today, which suggests that it is gaining traction compared to its peers.<BR><BR>Moreover, there is a notable rise in investor participation, with a delivery volume of 4.24k on September 3, which has increased by 27.27% against the five-day average delivery volume. This increase in trading activity may reflect growing investor confidence in the stock. <BR><BR>While the stock has shown mixed performance over different periods, including a 1-month gain of 5.47% compared to a 2.44% decline in the Sensex, it is currently positioned higher than the 50-day, 100-day, and 200-day moving averages, although it remains lower than the 5-day and 20-day moving averages. This positioning indicates a relatively strong performance in the short term, contributing to the current rise in stock price.

View full answer

Who are in the management team of Cambridge Tech.?

01-Sep-2026

The management team of Cambridge Tech includes Dharani Raghurama Swaroop (Whole-time Director), Stefan Hetges, K Jayalakshmi Kumari, Ashish Bhattad (Company Secretary), Sridhar Lalpet, Naveen Kumar Yelloji, Manjula Aleti, A S Nageswar Rao, and Srinivas Medepalli, each bringing diverse expertise to the company.

The management team of Cambridge Tech includes the following individuals:<BR><BR>1. **Dharani Raghurama Swaroop** - Whole-time Director<BR>2. **Stefan Hetges** - Director<BR>3. **K Jayalakshmi Kumari** - Independent Director<BR>4. **Ashish Bhattad** - Company Secretary<BR>5. **Sridhar Lalpet** - Independent Director<BR>6. **Naveen Kumar Yelloji** - Director<BR>7. **Manjula Aleti** - Independent Director<BR>8. **A S Nageswar Rao** - Additional Director<BR>9. **Srinivas Medepalli** - Independent Director<BR><BR>This team brings a diverse range of expertise to the company. If you need more specific information about any of the members or their roles, feel free to ask!

View full answer

What does Cambridge Tech. do?

01-Sep-2026

Cambridge Technology Enterprises Ltd is a Micro Cap company in the Computers - Software & Consulting industry, originally incorporated in 1999. As of June 2026, it reported net sales of 48 Cr and a net profit of 7 Cr.

Overview: <BR>Cambridge Technology Enterprises Ltd operates in the Computers - Software & Consulting industry and is categorized as a Micro Cap company.<BR><BR>History: <BR>The company was originally incorporated on 28 January, 1999, as 'Unique Solutions (India) Private Limited' in Hyderabad, Andhra Pradesh. It underwent several name changes, becoming 'Cell Exchange (India) Private Limited' on January 21, 2003, and then 'Cambridge Technology Enterprises Pvt Ltd' on 12 March, 2004. The latest quarterly results reported net sales and net profit for the period ending June 2026.<BR><BR>Financial Snapshot: <BR>- Net Sales: 48 Cr (Quarterly Results - Jun 2026) <BR>- Net Profit: 7 Cr (Quarterly Results - Jun 2026) <BR>- Market Cap: INR 93 Cr (Micro Cap) <BR><BR>Key Metrics: <BR>- P/E: 13.00 <BR>- Industry P/E: 22 <BR>- Dividend Yield: 0.00% <BR>- Debt-Equity: 0.84 <BR>- Return on Equity: 0.58% <BR>- Price to Book: 1.14 <BR><BR>Contact Details: <BR>Address: Unit No 04-03 Level 4 Block I, Cyber Pearl MadhapurSpazio Ban Hyderabad Telangana : 500081 <BR>Tel: 91-40-40234400 <BR>Email: investors@ctepl.com <BR>Website: http://www.ctepl.com

View full answer

Who are the peers of the Cambridge Tech.?

01-Sep-2026

Cambridge Tech.'s peers include Cressanda Railwa, Titan Intech, CG-VAK Software, R S Software (I), Athena Global, Odigma Consultan, Delaplex, Diensten Tech, Trust Fintech, and Richa Info. Cambridge Tech. has the highest 1-year return at 7.82%, while R S Software (I) has the lowest at -58.17%.

Peers: The peers of Cambridge Tech. are Cressanda Railwa, Titan Intech, CG-VAK Software, R S Software (I), Athena Global, Odigma Consultan, Delaplex, Diensten Tech, Trust Fintech, and Richa Info.<BR><BR>Quality Snapshot: Excellent management risk is observed at Titan Intech and CG-VAK Software, while Average management risk is found at R S Software (I). Below Average management risk is noted at Cressanda Railwa, Cambridge Tech., Athena Global, Odigma Consultan, Diensten Tech, Trust Fintech, and Richa Info. Growth is Excellent at Titan Intech and Diensten Tech, Average at Cambridge Tech., and Below Average at Cressanda Railwa, CG-VAK Software, R S Software (I), Athena Global, Odigma Consultan, Delaplex, Trust Fintech, and Richa Info. Capital Structure is Excellent at CG-VAK Software and Delaplex, Good at Titan Intech and Odigma Consultan, and Average at Cambridge Tech., while Below Average is seen at Cressanda Railwa, R S Software (I), Athena Global, Diensten Tech, Trust Fintech, and Richa Info.<BR><BR>Return Snapshot: The peer with the highest 1-year return is Cambridge Tech. at 7.82%, while the lowest is R S Software (I) at -58.17%. Cambridge Tech.'s return is significantly higher than that of R S Software (I). Additionally, the six-month returns for Cressanda Railwa, Titan Intech, CG-VAK Software, R S Software (I), Athena Global, Odigma Consultan, Diensten Tech, and Richa Info are all negative.

View full answer

How big is Cambridge Tech.?

01-Sep-2026

As of 31st August, Cambridge Technology Enterprises Ltd has a market capitalization of 93.00 Cr, with Net Sales of 179.13 Cr and a Net Profit of 6.96 Cr reported over the latest four quarters.

As of 31st August, Cambridge Technology Enterprises Ltd has a market capitalization of 93.00 Cr, categorizing it as a Micro Cap company.<BR><BR>In the latest four quarters, the company reported Net Sales of 179.13 Cr and a Net Profit of 6.96 Cr.<BR><BR>The latest annual period for the balance sheet is March 2025, with Shareholder's Funds amounting to 67.95 Cr and Total Assets of 193.26 Cr.

View full answer

Should I buy, sell or hold Cambridge Technology Enterprises Ltd?

16-Aug-2026

Are Cambridge Technology Enterprises Ltd latest results good or bad?

01-Jun-2026

Cambridge Technology Enterprises Ltd's latest results show a return to profitability with a net profit of ₹3.84 crores, but a significant year-on-year revenue decline of 21.08% raises concerns about its financial health and sustainability. Investors should be cautious due to ongoing operational challenges despite improved operating margins.

Cambridge Technology Enterprises Ltd's latest results present a mixed picture. On one hand, the company has returned to quarterly profitability with a net profit of ₹3.84 crores in Q4 FY26, which is a significant improvement of 207.20% compared to the previous quarter. This indicates effective cost management, particularly in reducing employee expenses.<BR><BR>However, the overall financial health raises concerns. The company experienced a substantial revenue decline of 21.08% year-on-year and 14.73% quarter-on-quarter, marking the lowest revenue in the past seven quarters at ₹39.88 crores. This persistent drop in revenue highlights ongoing operational challenges and raises questions about the company's ability to sustain its margins in a competitive market.<BR><BR>While the operating margin improved to 13.16% from just 1.21% a year ago, this improvement was largely driven by cost-cutting measures rather than revenue growth. The company also reported a full-year loss of ₹48.00 crores for FY25, which significantly impacted shareholder equity.<BR><BR>In summary, while the return to profitability is a positive sign, the significant revenue decline and the overall operational challenges suggest that the results are not entirely good. Investors should be cautious, as the company faces structural issues that need to be addressed for sustainable growth.

View full answer

When is the next results date for Cambridge Technology Enterprises Ltd?

27-May-2026

The next results date for Cambridge Technology Enterprises Ltd is 30 May 2026.

The next results date for Cambridge Technology Enterprises Ltd is scheduled for 30 May 2026.

View full answer

How has been the historical performance of Cambridge Tech.?

17-Nov-2025

Cambridge Tech's historical performance has been volatile, with net sales peaking at 206.23 Cr in March 2024 before declining to 198.92 Cr in March 2025, resulting in significant losses and negative operating profit of -26.83 Cr in March 2025. Despite an increase in total assets, the company's liabilities also rose, indicating a growing debt burden.

Answer:<BR>The historical performance of Cambridge Tech has shown significant fluctuations over the years, particularly in its financial results for the fiscal years ending March from 2019 to 2025.<BR><BR>Breakdown:<BR>Cambridge Tech's net sales peaked at 206.23 Cr in March 2024 but declined to 198.92 Cr in March 2025. The total operating income followed a similar trend, reaching 206.23 Cr in March 2024 before dropping to 198.92 Cr in March 2025. The company's total expenditure, excluding depreciation, increased significantly from 79.50 Cr in March 2019 to 225.75 Cr in March 2025, leading to an operating profit (PBDIT) that turned negative at -26.83 Cr in March 2025, down from a profit of 21.17 Cr in March 2024. Consequently, the profit before tax also fell sharply to -46.05 Cr in March 2025, compared to a profit of 8.04 Cr the previous year. The profit after tax mirrored this decline, resulting in a loss of -48.06 Cr in March 2025, down from a profit of 5.58 Cr in March 2024. The company's earnings per share (EPS) reflected this downturn, falling to -24.48 in March 2025 from 2.84 in March 2024. On the balance sheet, total assets increased from 100.60 Cr in March 2020 to 193.26 Cr in March 2025, while total liabilities rose from 79.50 Cr in March 2019 to 193.26 Cr in March 2025, indicating a growing debt burden. The cash flow from operating activities improved to 52.00 Cr in March 2025, contrasting with a negative cash flow of -22.00 Cr in March 2023, but overall net cash outflow was -22.00 Cr in March 2025.

View full answer

Who are the top shareholders of the Cambridge Tech.?

17-Jul-2025

The top shareholders of Cambridge Tech include Cloud Computing LLC with 50.91%, Smartshift AG as the largest public shareholder at 6.22%, and individual investors holding 35.23%. There is also one foreign institutional investor with a 0.03% stake, and no mutual funds are currently invested in the company.

The top shareholders of Cambridge Tech are primarily the promoters, with Cloud Computing LLC holding the largest share at 50.91%. In addition to this, Smartshift AG is the highest public shareholder, owning 6.22%. Individual investors collectively hold 35.23% of the company’s shares. There is one foreign institutional investor (FII) that holds a small stake of 0.03%, and there are no mutual funds currently invested in the company.

View full answer

Is Cambridge Tech. overvalued or undervalued?

09-Jun-2025

As of November 18, 2024, Cambridge Tech's valuation has shifted from very attractive to risky, with a negative PE ratio of -1.90, an EV to EBITDA of -6.80, and a troubling year-to-date return of -56.80%, significantly underperforming its peers and the Sensex.

As of 18 November 2024, the valuation grade for Cambridge Tech. has moved from very attractive to risky. This shift indicates a significant deterioration in the company's financial health and market perception. The company is currently deemed overvalued, with a PE ratio of -1.90, an EV to EBITDA of -6.80, and a ROE of -29.94%. <BR><BR>In comparison to its peers, Cambridge Tech. stands out negatively; for instance, TCS has a PE ratio of 25.23 and an EV to EBITDA of 17.63, while Infosys shows a PE of 24.32 and an EV to EBITDA of 15.83. The stark contrast in these ratios highlights the challenges faced by Cambridge Tech. Additionally, the company's recent stock performance has been troubling, with a year-to-date return of -56.80%, significantly underperforming the Sensex, which has returned 5.66% in the same period.

View full answer

What is the technical trend for Cambridge Tech.?

09-Jun-2025

As of May 14, 2025, Cambridge Tech's trend is mildly bearish, with conflicting signals from indicators like the weekly MACD and KST showing mild bullishness, while the monthly MACD and Bollinger Bands remain bearish.

As of 14 May 2025, the technical trend for Cambridge Tech has changed from bearish to mildly bearish. The weekly MACD indicates a mildly bullish stance, while the monthly MACD remains bearish. The daily moving averages are mildly bearish, and the Bollinger Bands show a bearish trend on both weekly and monthly time frames. The KST is mildly bullish on the weekly but mildly bearish on the monthly. Overall, the indicators suggest a mildly bearish sentiment with some conflicting signals, particularly in the weekly MACD and KST.

View full answer

Has Cambridge Tech. declared dividend?

06-Jun-2025

Yes, Cambridge Technology Enterprises Ltd has declared a 5% dividend, amounting to 0.4000 per share, with an ex-date of October 16, 2008. However, the dividend yield is 0%, and total returns have varied significantly, showing negative returns in the short term and positive returns over longer periods.

Cambridge Technology Enterprises Ltd has declared a dividend.<BR><BR>Dividend Details:<BR>- Percentage announced: 5%<BR>- Amount per share: 0.4000<BR>- Ex-date: 16 Oct 08<BR><BR>Dividend Yield: 0%<BR><BR>Total Returns by Period:<BR>Over the 6-month period, the price return was -55.17%, the dividend return was 0%, resulting in a total return of -55.17%.<BR><BR>In the 1-year period, the price return was -42.28%, the dividend return was 0%, leading to a total return of -42.28%.<BR><BR>For the 2-year period, the price return was -30.81%, with a dividend return of 0%, culminating in a total return of -30.81%.<BR><BR>During the 3-year period, the price return was -29.74%, the dividend return was 0%, which resulted in a total return of -29.74%.<BR><BR>In the 4-year period, the price return was 38.63%, the dividend return was 0%, yielding a total return of 38.63%.<BR><BR>Over the 5-year period, the price return was 133.13%, with a dividend return of 0%, resulting in a total return of 133.13%.<BR><BR>Overall, while Cambridge Technology Enterprises Ltd has declared a dividend, the dividend yield remains at 0%. The total returns over various periods show significant fluctuations, with negative returns in the shorter terms and positive returns in the longer terms.

View full answer
iScoreScore
Click here to find our call on this stock
Strong Sell
Sell
Hold
Buy
Strong Buy

Dashboard

1

Weak Long Term Fundamental Strength with an average Return on Capital Employed (ROCE) of 6.09%

  • Poor long term growth as Net Sales has grown by an annual rate of 9.75% over the last 5 years
2

With a growth in Operating Profit of 115.66%, the company declared Very Positive results in Jun 26

3

With ROCE of 4.1, it has a Attractive valuation with a 1 Enterprise value to Capital Employed

4

Rising Promoter Confidence

stock-summaryMojo Parameters

Mojo Parameters

Loading Valuation Snapshot...

Stock DNA

stock-summary
Industry

Computers - Software & Consulting

stock-summary
Market cap

INR 79 Cr (Micro Cap)

stock-summary
P/E

11.00

stock-summary
Industry P/E

21

stock-summary
Dividend Yield

0.00%

stock-summary
Debt Equity

0.84

stock-summary
Return on Equity

0.58%

stock-summary
Price to Book

0.97

Revenue and Profits:
Net Sales:
48 Cr
(Quarterly Results - Jun 2026)
Net Profit:
7 Cr
stock-summaryTotal Returns
Total Returns (Price + Dividend) stock-summary
Dividend Yield (0%)
TimePeriod
Price Return
Dividend Return
Total Return
3 Months
27.03%
0%
27.03%
6 Months
71.37%
0%
71.37%
1 Year
1.29%
0%
1.29%
2 Years
-56.86%
0%
-56.86%
3 Years
-27.39%
0%
-27.39%
4 Years
-41.44%
0%
-41.44%
5 Years
-35.75%
0%
-35.75%

Latest dividend: 0.4000 per share ex-dividend date: Oct-16-2008

Risk Adjusted Returns v/s stock-summary
Returns Beta
Icon
Beta has not been calculated since enough price history is not available
stock-summaryNews & Corporate Actions

News

Announcements stock-summary

Announcement under Regulation 30 (LODR)-Newspaper Publication

08-Sep-2026 | Source : BSE

Copy of the Newspaper Publication of Notice of 27th Annual General meeting.

Announcement Under Regulation 30 - Letter Sent To Shareholders Of The Company

07-Sep-2026 | Source : BSE

Please find enclosed herewith the letter sent to the shareholders of the Company under Regulation 36 of the SEBI Listing Regulations whose email address are not registered with the Company/ RTA/ Depository Participants.

Reg. 34 (1) Annual Report.

07-Sep-2026 | Source : BSE

Submission of 27th Annual Report of the Company for the Financial Year 2025-26.

Corporate Actions stock-summary

stock-summary
BOARD MEETING

No Upcoming Board Meetings

stock-summary
DIVIDEND

Cambridge Technology Enterprises Ltd has declared 5% dividend, ex-date: 16 Oct 08

stock-summary
SPLITS

No Splits history available

stock-summary
BONUS

No Bonus history available

stock-summary
RIGHTS

No Rights history available

stock-summaryKey Factors

Quality key factors stock-summary

Factor
Value
Sales Growth (5y)
9.75%
EBIT Growth (5y)
34.47%
EBIT to Interest (avg)
2.31
Debt to EBITDA (avg)
2.52
Net Debt to Equity (avg)
0.84
Sales to Capital Employed (avg)
1.12
Tax Ratio
15.43%
Dividend Payout Ratio
0
Pledged Shares
0
Institutional Holding
0
ROCE (avg)
-0.30%
ROE (avg)
5.41%

Valuation key factors

Factor
Value
P/E Ratio
11
Industry P/E
21
Price to Book Value
0.99
EV to EBIT
10.66
EV to EBITDA
6.91
EV to Capital Employed
1.00
EV to Sales
0.82
PEG Ratio
0.10
Dividend Yield
NA
ROCE (Latest)
4.08%
ROE (Latest)
0.58%

Technicals key factors

Indicator
Weekly
Monthly
MACD
Bullish
Mildly Bullish
RSI
No Signal
Bearish
Bollinger Bands
Mildly Bullish
Mildly Bullish
Moving Averages
Bullish (Daily)
KST
Bullish
Mildly Bullish
Dow Theory
Mildly Bearish
No Trend
OBV
Mildly Bearish
No Trend
stock-summary Technical Indicator Scale: Bearish, Mildly Bearish, Sideways, Mildly Bullish, Bullish  Turned 
stock-summaryShareholding
Shareholding Snapshot : Jun 2026stock-summary
Shareholding Compare (%holding) stock-summary
Majority shareholders

Promoters

Pledged Promoter Holdings

None

Mutual Funds

Held by 0 Schemes

FIIs

Held by 0 FIIs

Promoter with highest holding

Cloud Computing Llc (57.13%)

Highest Public shareholder

Devinder Parkash Kalra (2.64%)

Individual Investors Holdings

35.39%

stock-summaryFinancial
[
  {
    "link": "quarterly",
    "btn_text": "All Quarterly Results",
    "header": "Quarterly Results Snapshot (Consolidated) - Jun'26 - QoQ",
    "rhs": [
      {
        "prefix": "Net Sales ",
        "suffix": "QoQ Growth in quarter ended Jun 2026 is 21.29% vs -14.73% in Mar 2026",
        "dir": 1
      },
      {
        "prefix": "Consolidated Net Profit ",
        "suffix": "QoQ Growth in quarter ended Jun 2026 is 84.38% vs 207.20% in Mar 2026",
        "dir": -1
      }
    ],
    "table": {
      "header": [
        "Jun'26",
        "Mar'26",
        "Change(%)"
      ],
      "body": [
        {
          "field": "Net Sales",
          "val1": "48.37",
          "val2": "39.88",
          "chgp": "21.29%",
          "chgp_class": "positive"
        },
        {
          "field": "Operating Profit (PBDIT) excl Other Income",
          "val1": "9.47",
          "val2": "5.25",
          "chgp": "80.38%",
          "chgp_class": "positive"
        },
        {
          "field": "Interest",
          "val1": "1.37",
          "val2": "1.80",
          "chgp": "-23.89%",
          "chgp_class": "positive"
        },
        {
          "field": "Exceptional Items",
          "val1": "0.00",
          "val2": "0.00",
          "chgp": "",
          "chgp_class": "neutral"
        },
        {
          "field": "Consolidate Net Profit",
          "val1": "7.08",
          "val2": "3.84",
          "chgp": "84.38%",
          "chgp_class": "positive"
        },
        {
          "field": "Operating Profit Margin (Excl OI)",
          "val1": "19.58%",
          "val2": "13.16%",
          "chgp": "6.42%",
          "chgp_class": "positive"
        }
      ]
    }
  },
  {
    "link": "half-yearly",
    "btn_text": "All Half Yearly Results",
    "header": "Half Yearly Results Snapshot (Consolidated) - Sep'25",
    "rhs": [
      {
        "prefix": "Net Sales ",
        "suffix": " Growth in half year ended Sep 2025 is -2.52% vs 0.56% in Sep 2024",
        "dir": -1
      },
      {
        "prefix": "Consolidated Net Profit ",
        "suffix": " Growth in half year ended Sep 2025 is 87.65% vs -423.08% in Sep 2024",
        "dir": 1
      }
    ],
    "table": {
      "header": [
        "Sep'25",
        "Sep'24",
        "Change(%)"
      ],
      "body": [
        {
          "field": "Net Sales",
          "val1": "94.37",
          "val2": "96.81",
          "chgp": "-2.52%",
          "chgp_class": "negative"
        },
        {
          "field": "Operating Profit (PBDIT) excl Other Income",
          "val1": "3.00",
          "val2": "-28.25",
          "chgp": "110.62%",
          "chgp_class": "positive"
        },
        {
          "field": "Interest",
          "val1": "4.37",
          "val2": "5.55",
          "chgp": "-21.26%",
          "chgp_class": "positive"
        },
        {
          "field": "Exceptional Items",
          "val1": "0.00",
          "val2": "0.00",
          "chgp": "",
          "chgp_class": "neutral"
        },
        {
          "field": "Consolidate Net Profit",
          "val1": "-4.62",
          "val2": "-37.40",
          "chgp": "87.65%",
          "chgp_class": "positive"
        },
        {
          "field": "Operating Profit Margin (Excl OI)",
          "val1": "3.18%",
          "val2": "-29.18%",
          "chgp": "32.36%",
          "chgp_class": "positive"
        }
      ]
    }
  },
  {
    "link": "nine-monthly",
    "btn_text": "All Nine Monthly Results",
    "header": "Nine Monthly Results Snapshot (Consolidated) - Dec'25",
    "rhs": [
      {
        "prefix": "Net Sales ",
        "suffix": "YoY Growth in nine months ended Dec 2025 is -4.89% vs -0.52% in Dec 2024",
        "dir": -1
      },
      {
        "prefix": "Consolidated Net Profit ",
        "suffix": "YoY Growth in nine months ended Dec 2025 is 91.94% vs -2,140.49% in Dec 2024",
        "dir": 1
      }
    ],
    "table": {
      "header": [
        "Dec'25",
        "Dec'24",
        "Change(%)"
      ],
      "body": [
        {
          "field": "Net Sales",
          "val1": "141.14",
          "val2": "148.39",
          "chgp": "-4.89%",
          "chgp_class": "negative"
        },
        {
          "field": "Operating Profit (PBDIT) excl Other Income",
          "val1": "9.69",
          "val2": "-27.43",
          "chgp": "135.33%",
          "chgp_class": "positive"
        },
        {
          "field": "Interest",
          "val1": "6.11",
          "val2": "8.76",
          "chgp": "-30.25%",
          "chgp_class": "positive"
        },
        {
          "field": "Exceptional Items",
          "val1": "0.00",
          "val2": "0.00",
          "chgp": "",
          "chgp_class": "neutral"
        },
        {
          "field": "Consolidate Net Profit",
          "val1": "-3.37",
          "val2": "-41.83",
          "chgp": "91.94%",
          "chgp_class": "positive"
        },
        {
          "field": "Operating Profit Margin (Excl OI)",
          "val1": "6.87%",
          "val2": "-18.49%",
          "chgp": "25.36%",
          "chgp_class": "positive"
        }
      ]
    }
  },
  {
    "link": "annual",
    "btn_text": "All Annual Results",
    "header": "Annual Results Snapshot (Consolidated) - Mar'26",
    "rhs": [
      {
        "prefix": "Net Sales ",
        "suffix": "YoY Growth in year ended Mar 2026 is -8.99% vs -3.54% in Mar 2025",
        "dir": -1
      },
      {
        "prefix": "Consolidated Net Profit ",
        "suffix": "YoY Growth in year ended Mar 2026 is 101.00% vs -961.29% in Mar 2025",
        "dir": 1
      }
    ],
    "table": {
      "header": [
        "Mar'26",
        "Mar'25",
        "Change(%)"
      ],
      "body": [
        {
          "field": "Net Sales",
          "val1": "181.03",
          "val2": "198.92",
          "chgp": "-8.99%",
          "chgp_class": "negative"
        },
        {
          "field": "Operating Profit (PBDIT) excl Other Income",
          "val1": "14.95",
          "val2": "-26.83",
          "chgp": "155.72%",
          "chgp_class": "positive"
        },
        {
          "field": "Interest",
          "val1": "7.90",
          "val2": "9.36",
          "chgp": "-15.60%",
          "chgp_class": "positive"
        },
        {
          "field": "Exceptional Items",
          "val1": "0.00",
          "val2": "0.00",
          "chgp": "",
          "chgp_class": "neutral"
        },
        {
          "field": "Consolidate Net Profit",
          "val1": "0.48",
          "val2": "-48.06",
          "chgp": "101.00%",
          "chgp_class": "positive"
        },
        {
          "field": "Operating Profit Margin (Excl OI)",
          "val1": "8.26%",
          "val2": "-13.49%",
          "chgp": "21.75%",
          "chgp_class": "positive"
        }
      ]
    }
  }
]

Quarterly Results Snapshot (Consolidated) - Jun'26 - QoQstock-summary

Jun'26
Mar'26
Change(%)
Net Sales
48.37
39.88
21.29%
Operating Profit (PBDIT) excl Other Income
9.47
5.25
80.38%
Interest
1.37
1.80
-23.89%
Exceptional Items
0.00
0.00
Consolidate Net Profit
7.08
3.84
84.38%
Operating Profit Margin (Excl OI)
19.58%
13.16%
6.42%
Values in Rs Cr.
Direction Arrows
Net Sales

QoQ Growth in quarter ended Jun 2026 is 21.29% vs -14.73% in Mar 2026

Direction Arrows
Consolidated Net Profit

QoQ Growth in quarter ended Jun 2026 is 84.38% vs 207.20% in Mar 2026

Half Yearly Results Snapshot (Consolidated) - Sep'25stock-summary

Sep'25
Sep'24
Change(%)
Net Sales
94.37
96.81
-2.52%
Operating Profit (PBDIT) excl Other Income
3.00
-28.25
110.62%
Interest
4.37
5.55
-21.26%
Exceptional Items
0.00
0.00
Consolidate Net Profit
-4.62
-37.40
87.65%
Operating Profit Margin (Excl OI)
3.18%
-29.18%
32.36%
Values in Rs Cr.
Direction Arrows
Net Sales

Growth in half year ended Sep 2025 is -2.52% vs 0.56% in Sep 2024

Direction Arrows
Consolidated Net Profit

Growth in half year ended Sep 2025 is 87.65% vs -423.08% in Sep 2024

Nine Monthly Results Snapshot (Consolidated) - Dec'25stock-summary

Dec'25
Dec'24
Change(%)
Net Sales
141.14
148.39
-4.89%
Operating Profit (PBDIT) excl Other Income
9.69
-27.43
135.33%
Interest
6.11
8.76
-30.25%
Exceptional Items
0.00
0.00
Consolidate Net Profit
-3.37
-41.83
91.94%
Operating Profit Margin (Excl OI)
6.87%
-18.49%
25.36%
Values in Rs Cr.
Direction Arrows
Net Sales

YoY Growth in nine months ended Dec 2025 is -4.89% vs -0.52% in Dec 2024

Direction Arrows
Consolidated Net Profit

YoY Growth in nine months ended Dec 2025 is 91.94% vs -2,140.49% in Dec 2024

Annual Results Snapshot (Consolidated) - Mar'26stock-summary

Mar'26
Mar'25
Change(%)
Net Sales
181.03
198.92
-8.99%
Operating Profit (PBDIT) excl Other Income
14.95
-26.83
155.72%
Interest
7.90
9.36
-15.60%
Exceptional Items
0.00
0.00
Consolidate Net Profit
0.48
-48.06
101.00%
Operating Profit Margin (Excl OI)
8.26%
-13.49%
21.75%
Values in Rs Cr.
Direction Arrows
Net Sales

YoY Growth in year ended Mar 2026 is -8.99% vs -3.54% in Mar 2025

Direction Arrows
Consolidated Net Profit

YoY Growth in year ended Mar 2026 is 101.00% vs -961.29% in Mar 2025

stock-summaryCompany CV
About Cambridge Technology Enterprises Ltd stock-summary
stock-summary
Cambridge Technology Enterprises Ltd
Micro Cap
Computers - Software & Consulting
Cambridge Technology Enterprises Limited was originally incorporated on 28 January, 1999 as 'Unique Solutions (India) Private Limited' at Hyderabad, Andhra Pradesh. The name of the Company was changed to 'Cell Exchange (India) Private Limited' on January 21, 2003 and subsequently to 'Cambridge Technology Enterprises Pvt Ltd' on 12 March, 2004 which was reverted back to its old name i.e.
Company Coordinates stock-summary
Company Details
Unit No 04-03 Level 4 Block I, Cyber Pearl MadhapurSpazio Ban Hyderabad Telangana : 500081
stock-summary
Tel: 91-40-40234400
stock-summary
investors@ctepl.com
Registrar Details
Aarthi Consultants Pvt Ltd, 1-2-285 , Domalaguda, Hyderabad