
Compare Camden Property Trust with Similar Stocks
Dashboard
1
Poor long term growth as Net Sales has grown by an annual rate of 8.31% and Operating profit at 2.61%
2
The company has declared Negative results for the last 3 consecutive quarters
3
With ROE of 3.45%, it has a very expensive valuation with a 3.78 Price to Book Value
4
Consistent Underperformance against the benchmark over the last 3 years
Total Returns (Price + Dividend) 
TimePeriod
Price Return
Dividend Return
Total Return
3 Months
-11.61%
0%
-11.61%
6 Months
-11.54%
0%
-11.54%
1 Year
0.31%
0%
0.31%
2 Years
-4.75%
0%
-4.75%
3 Years
-19.02%
0%
-19.02%
4 Years
-20.13%
0%
-20.13%
5 Years
11.41%
0%
11.41%
Camden Property Trust for the last several years.
Risk Adjusted Returns v/s
News
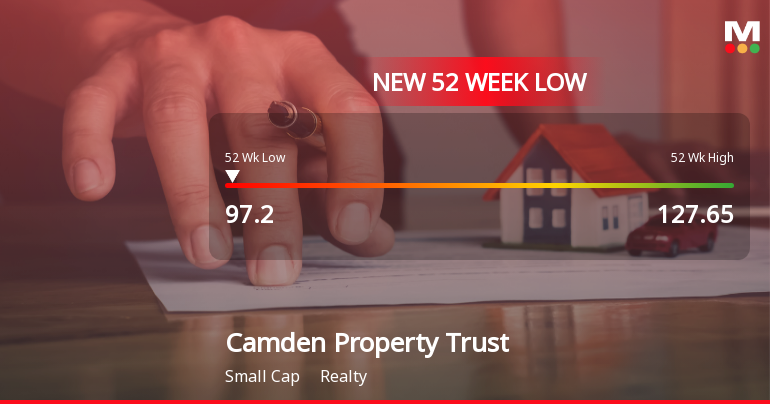
Camden Property Trust Hits New 52-Week Low at $97.20
Camden Property Trust has reached a 52-week low, reflecting a significant decline in its stock price over the past year. The company has reported a substantial drop in net profit and a high price-to-earnings ratio, while maintaining a notable dividend yield amid ongoing financial challenges.
Read full news article Announcements

No announcement available
Corporate Actions
No corporate action available
Quality key factors
Factor
Value
Sales Growth (5y)
8.31%
EBIT Growth (5y)
2.61%
EBIT to Interest (avg)
5.11
Debt to EBITDA (avg)
Negative Net Debt
Net Debt to Equity (avg)
0
Sales to Capital Employed (avg)
0
Tax Ratio
2.01%
Dividend Payout Ratio
274.34%
Pledged Shares
0
Institutional Holding
100.00%
ROCE (avg)
11.19%
ROE (avg)
7.33%
Valuation key factors
Factor
Value
P/E Ratio
110
Industry P/E
Price to Book Value
3.78
EV to EBIT
58.09
EV to EBITDA
19.63
EV to Capital Employed
3.80
EV to Sales
11.14
PEG Ratio
NA
Dividend Yield
253.72%
ROCE (Latest)
6.54%
ROE (Latest)
3.44%
Technicals key factors
Indicator
Weekly
Monthly
MACD
Mildly Bullish
Bearish
RSI
No Signal
No Signal
Bollinger Bands
Mildly Bullish
Bearish
Moving Averages
Mildly Bearish (Daily)
KST
Mildly Bullish
Bearish
Dow Theory
No Trend
Mildly Bullish
OBV
No Trend
Bullish
 Technical Indicator Scale: Bearish, Mildly Bearish, Sideways, Mildly Bullish, Bullish Turned
 Shareholding Snapshot : Sep 2025
Shareholding Compare (%holding)
Majority shareholders
Domestic Funds
Domestic Funds
Held in 127 Schemes (46.5%)
Foreign Institutions
Held by 303 Foreign Institutions (19.06%)
Strategic Entities with highest holding
Highest Public shareholder
Quarterly Results Snapshot (Consolidated) - Sep'25 - QoQ
Sep'25
Jun'25
Change(%)
Net Sales
398.00
398.90
-0.23%
Operating Profit (PBDIT) excl Other Income
222.90
223.70
-0.36%
Interest
34.70
35.10
-1.14%
Exceptional Items
0.00
0.00
Consolidate Net Profit
113.30
82.40
37.50%
Operating Profit Margin (Excl OI)
159.30%
179.50%
-2.02%
USD in Million.

Net Sales
QoQ Growth in quarter ended Sep 2025 is -0.23% vs 1.55% in Jun 2025
Consolidated Net Profit
QoQ Growth in quarter ended Sep 2025 is 37.50% vs 102.46% in Jun 2025
Annual Results Snapshot (Consolidated) - Dec'24
Dec'24
Dec'23
Change(%)
Net Sales
1,554.10
1,545.00
0.59%
Operating Profit (PBDIT) excl Other Income
882.40
898.10
-1.75%
Interest
128.50
132.00
-2.65%
Exceptional Items
-41.90
-2.50
-1,576.00%
Consolidate Net Profit
170.50
409.90
-58.40%
Operating Profit Margin (Excl OI)
193.30%
209.30%
-1.60%
USD in Million.
Net Sales
YoY Growth in year ended Dec 2024 is 0.59% vs 8.06% in Dec 2023
Consolidated Net Profit
YoY Growth in year ended Dec 2024 is -58.40% vs -37.94% in Dec 2023
About Camden Property Trust

Camden Property Trust
Realty
Camden Property Trust is a real estate investment trust (REIT). The Company is engaged in the ownership, management, development, redevelopment, acquisition and construction of multifamily apartment communities. As of December 31, 2016, the Company owned interests in, operated, or were developing 159 multifamily properties, which consisted of 55,366 apartment homes across the United States. The Company also owns land holdings, which it may develop into multifamily communities. The Company's properties consist of mid-rise buildings or two and three story buildings in a landscaped setting and provide residents with a range of amenities common to multifamily rental properties. The 152 operating properties in which the Company owned interests and operated, as of December 31, 2016, averaged 953 square feet of living area per apartment home. As of December 31, 2016, 137 of its operating properties had over 200 apartment homes.
Company Coordinates
Company Details
11 Greenway Plz Ste 2400 , HOUSTON TX : 77046-1124


Registrar Details
InfinHub Market Technologies FZ-LLC, Building-2, Unit 112, Dubai Internet City, Dubai, United Arab Emirates
GET THE MARKETSMOJO APP


Company
Stocks
Portfolio


"Investment in securities markets are subject to market risk. Read all the related documents carefully before investing."