
Compare Campus Activewe. with Similar Stocks
Dashboard
High Management Efficiency with a high ROCE of 19.05%
Strong ability to service debt as the company has a low Debt to EBITDA ratio of 0.81 times
Poor long term growth as Net Sales has grown by an annual rate of 9.05% and Operating profit at 8.22% over the last 5 years
Positive results in Mar 26
With ROCE of 17.9, it has a Very Attractive valuation with a 6.5 Enterprise value to Capital Employed
Majority shareholders : Promoters
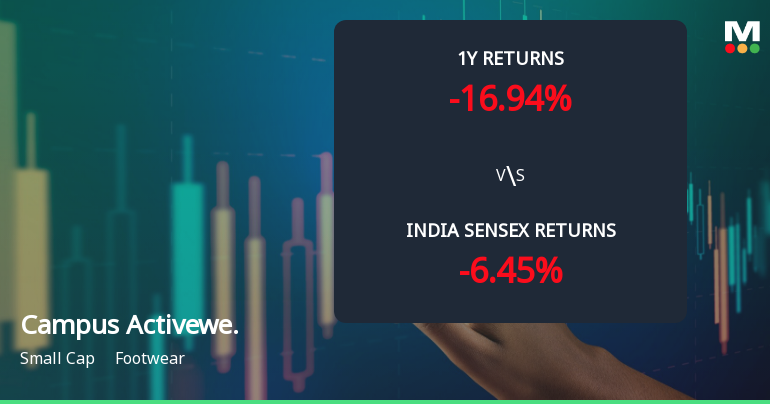
Consistent Underperformance against the benchmark over the last 3 years
Total Returns (Price + Dividend) 
Latest dividend: 0.3 per share ex-dividend date: Sep-10-2025
Risk Adjusted Returns v/s
Returns Beta

News
Campus Activewear Ltd Technical Momentum Shifts Amid Mixed Market Signals
Campus Activewear Ltd, a small-cap player in the footwear sector, has experienced a nuanced shift in its technical momentum, reflecting a complex interplay of bullish and bearish signals across multiple timeframes. Despite a recent upgrade in its Mojo Grade from Sell to Hold, the stock’s price action and key technical indicators suggest cautious optimism amid persistent headwinds.
Read full news article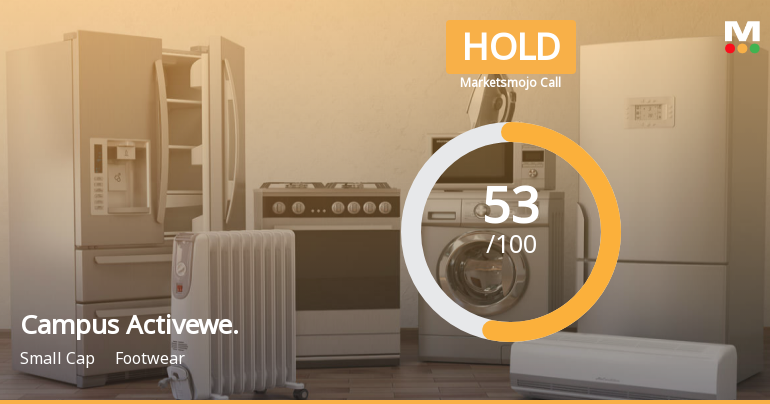
Campus Activewear Ltd is Rated Hold
Campus Activewear Ltd is rated 'Hold' by MarketsMOJO, with this rating last updated on 03 June 2026. However, the analysis and financial metrics discussed here reflect the stock's current position as of 19 June 2026, providing investors with an up-to-date view of the company’s fundamentals, returns, and market standing.
Read full news article
Campus Activewear Ltd Technical Momentum Shifts Amid Mixed Market Signals
Campus Activewear Ltd, a small-cap player in the footwear sector, has experienced a notable shift in its technical momentum, with key indicators signalling a bearish tilt despite some mildly bullish weekly signals. The stock’s recent downgrade from a Sell to a Hold rating by MarketsMOJO reflects this nuanced technical landscape, as investors weigh the mixed signals from MACD, RSI, moving averages, and other momentum indicators.
Read full news article Announcements
Announcement under Regulation 30 (LODR)-Allotment of ESOP / ESPS
18-Jun-2026 | Source : BSEAllotment of ESOP
Announcement under Regulation 30 (LODR)-Resignation of Chief Financial Officer (CFO)
12-Jun-2026 | Source : BSEResignation of CFO of Company
Announcement under Regulation 30 (LODR)-Earnings Call Transcript
29-May-2026 | Source : BSEEarnings Call Transcript
Corporate Actions

No Upcoming Board Meetings

Campus Activewear Ltd has declared 30% dividend, ex-date: 31 Jul 26

No Splits history available

No Bonus history available

No Rights history available
Quality key factors
Valuation key factors
Technicals key factors
 Technical Indicator Scale: Bearish, Mildly Bearish, Sideways, Mildly Bullish, Bullish Turned
 Shareholding Snapshot : Mar 2026
Shareholding Compare (%holding)
Promoters
None
Held by 13 Schemes (10.43%)
Held by 91 FIIs (6.07%)
Hari Krishan Agarwal (55.85%)
Mirae Asset Great Consumer Fund (3.09%)
8.91%
Quarterly Results Snapshot (Standalone) - Mar'26 - QoQ

QoQ Growth in quarter ended Mar 2026 is -22.59% vs 52.25% in Dec 2025
QoQ Growth in quarter ended Mar 2026 is -30.68% vs 217.29% in Dec 2025
Half Yearly Results Snapshot (Standalone) - Sep'25
Growth in half year ended Sep 2025 is 8.54% vs 9.80% in Sep 2024
Growth in half year ended Sep 2025 is 6.53% vs 24.78% in Sep 2024
Nine Monthly Results Snapshot (Standalone) - Dec'25

YoY Growth in nine months ended Dec 2025 is 11.05% vs 9.48% in Dec 2024
YoY Growth in nine months ended Dec 2025 is 22.98% vs 51.97% in Dec 2024
Annual Results Snapshot (Standalone) - Mar'26
YoY Growth in year ended Mar 2026 is 11.37% vs 9.99% in Mar 2025
YoY Growth in year ended Mar 2026 is 23.86% vs 35.49% in Mar 2025
About Campus Activewear Ltd

Company Coordinates


