
Compare Capillary Tech. with Similar Stocks
Stock DNA
Computers - Software & Consulting
INR 3,825 Cr (Small Cap)
95.00
20
0.00%
-0.42
2.68%
3.69
Total Returns (Price + Dividend) 
Capillary Tech. for the last several years.
Risk Adjusted Returns v/s
Returns Beta

News

Capillary Technologies India Ltd Surges 10.7% to Day's High of Rs 519.1 — Outperforms Sector by 6.17 Percentage Points
The Sensex advanced 0.88% on 27 Jul 2026, yet Capillary Technologies India Ltd outpaced the broader market with a robust 10.69% gain, reaching an intraday high of Rs 519.1. This 6.17-percentage-point outperformance over the IT - Software sector’s 2.27% rise signals a distinctly stock-specific momentum shift.
Read full news article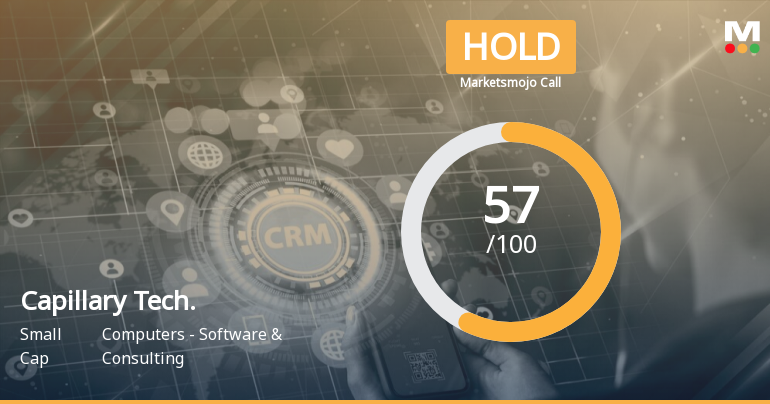
Capillary Technologies India Ltd is Rated Hold
Capillary Technologies India Ltd is rated 'Hold' by MarketsMOJO, with this rating last updated on 13 July 2026. While the rating change occurred on that date, the analysis and financial metrics discussed here reflect the company’s current position as of 20 July 2026, providing investors with the most up-to-date perspective on the stock’s fundamentals and market performance.
Read full news article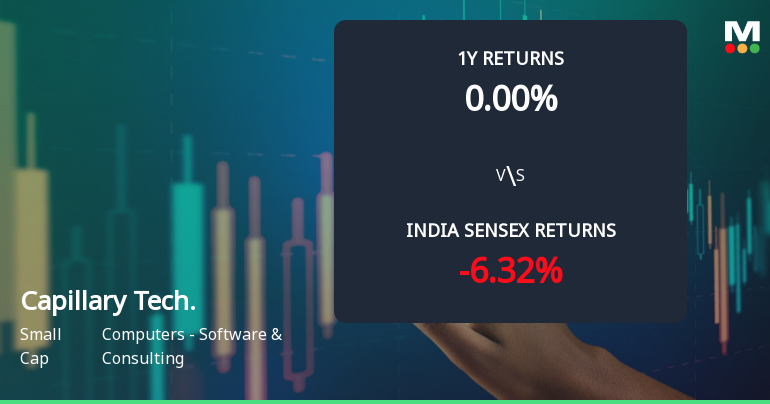
Capillary Technologies India Ltd Technical Momentum Shifts Amid Sideways Trend
Capillary Technologies India Ltd has experienced a notable shift in its technical momentum, moving from a mildly bullish stance to a sideways trend, reflecting a period of consolidation after recent price fluctuations. Despite a modest day change of 0.24%, the stock’s technical indicators reveal a complex picture that investors should carefully analyse amid broader market pressures and sector dynamics.
Read full news article Announcements
Announcement under Regulation 30 (LODR)-Allotment of ESOP / ESPS
23-Jul-2026 | Source : BSEAllotment of Equity Shares under Capillary Employees Stock Option Scheme - 2021
Announcement under Regulation 30 (LODR)-Analyst / Investor Meet - Intimation
11-Jul-2026 | Source : BSEIntimation of schedule of Investors Meeting.
Compliances-Certificate under Reg. 74 (5) of SEBI (DP) Regulations 2018
09-Jul-2026 | Source : BSECompliance certificate under Regulation 74 (5) of SEBI (DP) Regulations 2018 for the quarter ended June 30 2026
Corporate Actions

No Upcoming Board Meetings

No Dividend history available

No Splits history available

No Bonus history available

No Rights history available
Quality key factors
Valuation key factors
Technicals key factors
 Technical Indicator Scale: Bearish, Mildly Bearish, Sideways, Mildly Bullish, Bullish Turned
 Shareholding Snapshot : Jun 2026
Shareholding Compare (%holding)
Promoters
None
Held by 13 Schemes (14.82%)
Held by 17 FIIs (3.34%)
Capillary Technologies International Pte Ltd (48.92%)
Ronal Holdings Llc (6.95%)
4.75%
Quarterly Results Snapshot (Standalone) - Mar'26 - QoQ

QoQ Growth in quarter ended Mar 2026 is 12.14% vs 24.53% in Dec 2025

QoQ Growth in quarter ended Mar 2026 is 842.86% vs 135.71% in Dec 2025
Half Yearly Results Snapshot (Consolidated) - Sep'25
Not Applicable: The company has declared_date for only one period
Not Applicable: The company has declared_date for only one period
Nine Monthly Results Snapshot (Consolidated) - Dec'25
Not Applicable: The company has declared_date for only one period
Not Applicable: The company has declared_date for only one period
Annual Results Snapshot (Consolidated) - Mar'26
YoY Growth in year ended Mar 2026 is 22.79% vs 13.93% in Mar 2025
YoY Growth in year ended Mar 2026 is 294.50% vs 122.36% in Mar 2025
About Capillary Technologies India Ltd

Company Coordinates


