
Compare Capital India with Similar Stocks
Dashboard
Weak Long Term Fundamental Strength with an average Return on Equity (ROE) of 0.15%
- Poor long term growth as Operating profit has grown by an annual rate of -18.33%
Flat results in Mar 26
With ROE of -8, it has a Expensive valuation with a 1.3 Price to Book Value
Despite the size of the company, domestic mutual funds hold only 0% of the company
Below par performance in long term as well as near term
Stock DNA
Non Banking Financial Company (NBFC)
INR 860 Cr (Micro Cap)
NA (Loss Making)
21
0.09%
1.43
-7.96%
1.31
Total Returns (Price + Dividend) 
Latest dividend: 0.02 per share ex-dividend date: Sep-19-2025
Risk Adjusted Returns v/s
Returns Beta

News

Capital India Finance Ltd is Rated Strong Sell
Capital India Finance Ltd is rated Strong Sell by MarketsMOJO. This rating was last updated on 01 Jan 2026, reflecting a shift from the previous 'Sell' grade. However, the analysis and financial metrics discussed here represent the stock’s current position as of 08 July 2026, providing investors with the latest insights into its performance and outlook.
Read full news article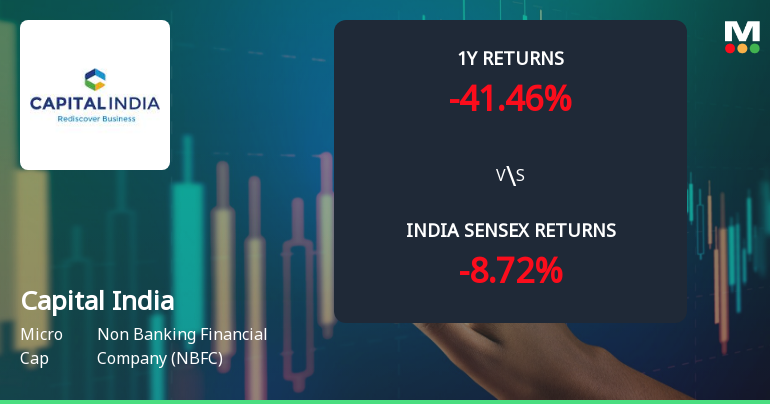
Capital India Finance Ltd Faces Intensified Downtrend Amid Technical Deterioration
Capital India Finance Ltd, a micro-cap player in the Non Banking Financial Company (NBFC) sector, has witnessed a marked shift in its technical momentum, signalling increased bearishness. With a significant drop of 8.28% on 30 June 2026 and a downgrade in its Mojo Grade from Sell to Strong Sell, the stock’s technical indicators reveal a deteriorating trend that investors should carefully consider.
Read full news article
Capital India Finance Ltd is Rated Strong Sell
Capital India Finance Ltd is rated Strong Sell by MarketsMOJO. This rating was last updated on 01 Jan 2026. However, the analysis and financial metrics discussed below reflect the stock’s current position as of 27 June 2026, providing investors with the latest insights into the company’s performance and outlook.
Read full news article Announcements
Compliances-Certificate under Reg. 74 (5) of SEBI (DP) Regulations 2018
07-Jul-2026 | Source : BSEDisclosure under Regulation 74(5) of SEBI (Depositories Participants) Regulations 2018.
Closure of Trading Window
26-Jun-2026 | Source : BSEIntimation for closure of Trading Window in accordance with the provisions of SEBI (Prohibition of Insider Trading) Regulations 2015
Announcement under Regulation 30 (LODR)-Newspaper Publication
24-Jun-2026 | Source : BSENewspaper Advertisement published with respect to Special Window for transfer and dematerialisation of physical shares and IEPFA Second 100 days campaign - Saksham Niveshak
Corporate Actions

No Upcoming Board Meetings

Capital India Finance Ltd has declared 1% dividend, ex-date: 19 Sep 25

Capital India Finance Ltd has announced 2:10 stock split, ex-date: 17 Feb 25

No Bonus history available

Capital India Finance Ltd has announced 4:5 rights issue, ex-date: 18 Dec 18
Quality key factors
Valuation key factors
Technicals key factors
 Technical Indicator Scale: Bearish, Mildly Bearish, Sideways, Mildly Bullish, Bullish Turned
 Shareholding Snapshot : Mar 2026
Shareholding Compare (%holding)
Promoters
None
Held by 0 Schemes
Held by 3 FIIs (0.03%)
Capital India Corp Private Limited (72.59%)
Dharampal Satyapal Limited (9.77%)
4.34%
Quarterly Results Snapshot (Consolidated) - Mar'26 - QoQ

QoQ Growth in quarter ended Mar 2026 is -14.88% vs 11.56% in Dec 2025

QoQ Growth in quarter ended Mar 2026 is 94.52% vs -106.51% in Dec 2025
Half Yearly Results Snapshot (Consolidated) - Sep'25
Growth in half year ended Sep 2025 is -11.11% vs -19.11% in Sep 2024
Growth in half year ended Sep 2025 is 2,794.48% vs -86.24% in Sep 2024
Nine Monthly Results Snapshot (Consolidated) - Dec'25
YoY Growth in nine months ended Dec 2025 is -4.68% vs -18.83% in Dec 2024
YoY Growth in nine months ended Dec 2025 is 1,724.77% vs -80.24% in Dec 2024
Annual Results Snapshot (Consolidated) - Mar'26
YoY Growth in year ended Mar 2026 is -3.32% vs -19.99% in Mar 2025
YoY Growth in year ended Mar 2026 is 2,409.03% vs -86.70% in Mar 2025
About Capital India Finance Ltd

Company Coordinates


