
Compare Capri Global with Similar Stocks
Dashboard
Strong Long Term Fundamental Strength with a 41.62% CAGR growth in Operating Profits
Healthy long term growth as Net Sales has grown by an annual rate of 45.40% and Operating profit at 41.62%
With a growth in Net Profit of 59.12%, the company declared Very Positive results in Mar 26
With ROE of 13.2, it has a Attractive valuation with a 2.9 Price to Book Value
High Institutional Holdings at 25.73%
Stock DNA
Non Banking Financial Company (NBFC)
INR 21,374 Cr (Small Cap)
22.00
21
0.09%
3.35
13.18%
2.95
Total Returns (Price + Dividend) 
Latest dividend: 0.2 per share ex-dividend date: Sep-11-2025
Risk Adjusted Returns v/s
Returns Beta

News
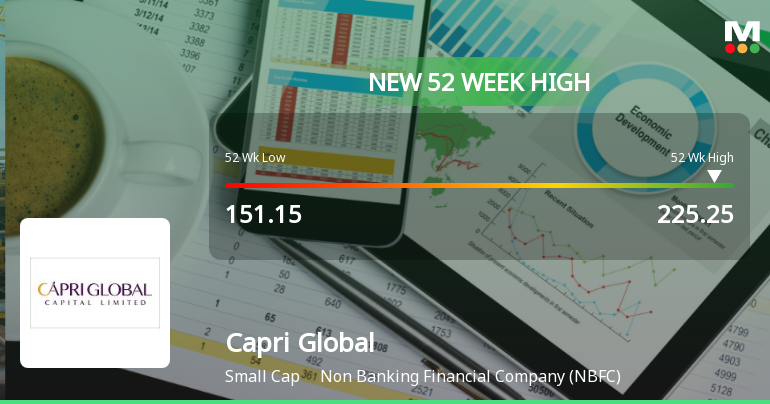
Broad-Based Technical Strength Lifts Capri Global Capital Ltd to 52-Week High of Rs 226
With a decisive break above Rs 226 on 19 Jun 2026, Capri Global Capital Ltd has reached a fresh 52-week high, extending its impressive 35.87% return over the past year. This milestone is underscored by a strong alignment of technical indicators and sustained price momentum, even as the broader Sensex trades lower by 1.07% on the day.
Read full news article
Capri Global Capital Ltd is Rated Buy
Capri Global Capital Ltd is rated 'Buy' by MarketsMOJO, with this rating last updated on 26 May 2026. However, the analysis and financial metrics discussed here reflect the stock's current position as of 19 June 2026, providing investors with an up-to-date view of its fundamentals, returns, and overall outlook.
Read full news article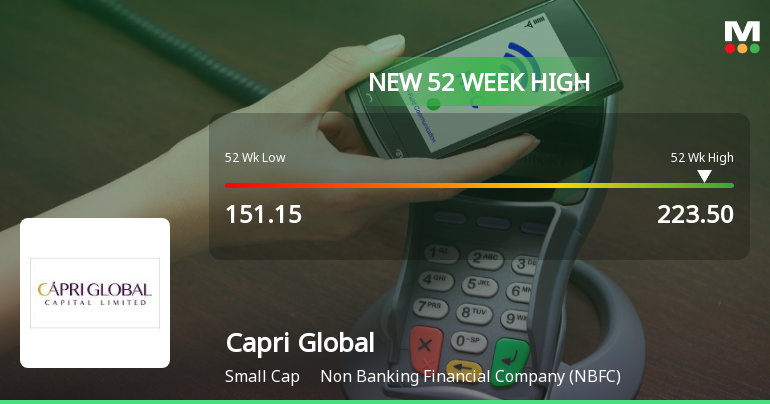
Broad-Based Technical Strength Lifts Capri Global Capital Ltd to 52-Week High of Rs 224.65
With every major moving average breached and a suite of bullish technical indicators aligning, Capri Global Capital Ltd surged to a fresh 52-week high of Rs 224.65 on 16 Jun 2026, marking a significant milestone in its upward trajectory.
Read full news article Announcements
Announcement under Regulation 30 (LODR)-Analyst / Investor Meet - Intimation
19-Jun-2026 | Source : BSEIntimation of Group Meeting with Analysts / Investors under Regulation 30 of SEBI (LODR) Regulations 2015
Announcement under Regulation 30 (LODR)-Analyst / Investor Meet - Intimation
18-Jun-2026 | Source : BSEIntimation of Group Meeting with Analysts / Investors under Regulation 30 of SEBI (LODR) Regulations 2015
Announcement under Regulation 30 (LODR)-Change in Directorate
16-Jun-2026 | Source : BSERe-appointment of 2 Independent Directors and Re-appointment of Mr. Rajesh Sharma - Director liable to retire by Rotation - subject to the approval by shareholders in the ensuing AGM
Corporate Actions

No Upcoming Board Meetings

Capri Global Capital Ltd has declared 20% dividend, ex-date: 11 Sep 25

Capri Global Capital Ltd has announced 1:2 stock split, ex-date: 05 Mar 24

Capri Global Capital Ltd has announced 1:1 bonus issue, ex-date: 05 Mar 24

Capri Global Capital Ltd has announced 11:64 rights issue, ex-date: 17 Feb 23
Quality key factors
Valuation key factors
Technicals key factors
 Technical Indicator Scale: Bearish, Mildly Bearish, Sideways, Mildly Bullish, Bullish Turned
 Shareholding Snapshot : Mar 2026
Shareholding Compare (%holding)
Promoters
None
Held by 17 Schemes (7.05%)
Held by 71 FIIs (5.62%)
Capri Global Ventures Private Limited (formally Known As Capri Global Holdings Private Limited) (41.1%)
Life Insurance Corporation Of India (8.22%)
3.1%
Quarterly Results Snapshot (Consolidated) - Mar'26 - YoY

YoY Growth in quarter ended Mar 2026 is 44.67% vs 47.58% in Mar 2025
YoY Growth in quarter ended Mar 2026 is 59.12% vs 115.21% in Mar 2025
Half Yearly Results Snapshot (Consolidated) - Sep'25

Growth in half year ended Sep 2025 is 44.63% vs 38.84% in Sep 2024
Growth in half year ended Sep 2025 is 137.91% vs 34.05% in Sep 2024
Nine Monthly Results Snapshot (Consolidated) - Dec'25
YoY Growth in nine months ended Dec 2025 is 46.21% vs 37.66% in Dec 2024
YoY Growth in nine months ended Dec 2025 is 121.53% vs 52.82% in Dec 2024
Annual Results Snapshot (Consolidated) - Mar'26
YoY Growth in year ended Mar 2026 is 45.67% vs 40.42% in Mar 2025
YoY Growth in year ended Mar 2026 is 98.35% vs 71.26% in Mar 2025
About Capri Global Capital Ltd

Company Coordinates


