
Compare Caprolactam Chem with Similar Stocks
Dashboard
Weak Long Term Fundamental Strength with an average Return on Capital Employed (ROCE) of 7.92%
- Poor long term growth as Net Sales has grown by an annual rate of 10.79% over the last 5 years
- Company's ability to service its debt is weak with a poor EBIT to Interest (avg) ratio of 1.07
With a growth in Net Profit of 90.91%, the company declared Very Positive results in Mar 26
With ROCE of 5.7, it has a Attractive valuation with a 2.2 Enterprise value to Capital Employed
Majority shareholders : Promoters
Market Beating Performance
Stock DNA
Commodity Chemicals
INR 23 Cr (Micro Cap)
13.00
13
0.00%
1.68
33.27%
4.31
Total Returns (Price + Dividend) 
Caprolactam Chem for the last several years.
Risk Adjusted Returns v/s
Returns Beta

News
Caprolactam Chemicals Ltd Upgraded to Hold on Improved Technicals and Financial Performance
Caprolactam Chemicals Ltd has seen its investment rating upgraded from Sell to Hold, reflecting a notable improvement in its technical indicators and robust quarterly financial results. The upgrade, effective from 22 July 2026, is driven by a combination of enhanced technical trends, strong financial growth, attractive valuation metrics, and a stabilising quality outlook amid a challenging commodity chemicals sector.
Read full news articleAre Caprolactam Chemicals Ltd latest results good or bad?
Caprolactam Chemicals Ltd has reported its financial results for the quarter ended March 2026, showcasing a notable operational turnaround. The company achieved net sales of ₹3.07 crores, reflecting a year-on-year growth of 90.68% and a quarter-on-quarter increase of 19.92%. This significant revenue growth indicates a recovery trajectory following previous challenges. The net profit for the quarter stood at ₹0.84 crores, marking a return to profitability compared to a loss in the same quarter last year. This represents a substantial improvement in the company's financial health. The operating margin reached 54.07%, the highest in eight quarters, demonstrating effective cost management and operational efficiency. Additionally, the profit after tax (PAT) margin improved to 27.36%, a stark contrast to the negative margin reported in the previous year. Despite these positive operational metrics, Caprolactam C...
Read full news article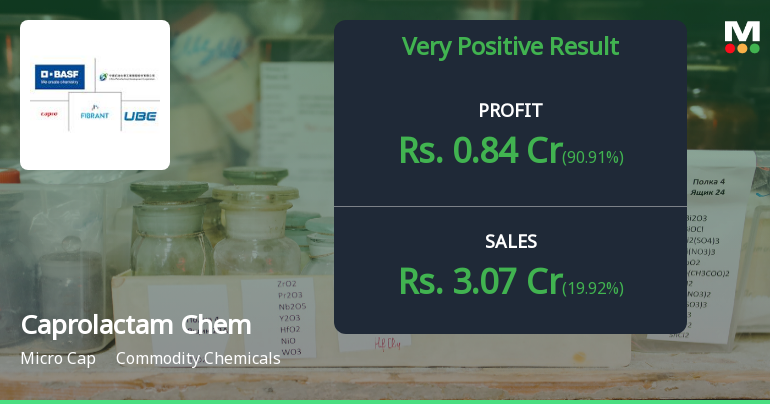
Caprolactam Chemicals Q4 FY26: Turnaround Gains Momentum but Valuation Concerns Persist
Caprolactam Chemicals Ltd., a micro-cap commodity chemicals manufacturer with a market capitalisation of ₹22.00 crores, reported a remarkable turnaround in Q4 FY26 (January-March 2026), posting net profit of ₹0.84 crores compared to a loss of ₹0.45 crores in the same quarter last year. The stock has responded positively to the operational recovery, gaining 18.60% over the past year, though it remains 39.46% below its 52-week high of ₹81.00. At the current market price of ₹49.04, the company trades at a concerning valuation of 2,254 times trailing twelve-month earnings, raising serious questions about sustainability despite improved fundamentals.
Read full news article Announcements
Compliances-Certificate under Reg. 74 (5) of SEBI (DP) Regulations 2018
02-Jul-2026 | Source : BSECompliance Certificate under Reg 74(5) of SEBI (Depositories and Participants) Regulations 2018
Closure of Trading Window
25-Jun-2026 | Source : BSEClosure of Trading Window
Announcement under Regulation 30 (LODR)-Newspaper Publication
01-Jun-2026 | Source : BSENewspaper Advertisement of the Audited Financial Result for Quarter ended 31 March 2026
Corporate Actions

No Upcoming Board Meetings

No Dividend history available

No Splits history available

No Bonus history available

No Rights history available
Quality key factors
Valuation key factors
Technicals key factors
 Technical Indicator Scale: Bearish, Mildly Bearish, Sideways, Mildly Bullish, Bullish Turned
 Shareholding Snapshot : Jun 2026
Shareholding Compare (%holding)
Promoters
None
Held by 0 Schemes
Held by 0 FIIs
Siddharth Shankarlal Bhanushali (22.98%)
Laxmidas V. Bhanushali (1.28%)
43.51%
Quarterly Results Snapshot (Standalone) - Mar'26 - QoQ

QoQ Growth in quarter ended Mar 2026 is 19.92% vs 8.47% in Dec 2025

QoQ Growth in quarter ended Mar 2026 is 90.91% vs 238.46% in Dec 2025
Half Yearly Results Snapshot (Standalone) - Sep'25
Growth in half year ended Sep 2025 is 73.59% vs -29.53% in Sep 2024
Growth in half year ended Sep 2025 is 313.04% vs -195.83% in Sep 2024
Nine Monthly Results Snapshot (Standalone) - Dec'25
YoY Growth in nine months ended Dec 2025 is 46.00% vs -7.07% in Dec 2024
YoY Growth in nine months ended Dec 2025 is 457.69% vs -425.00% in Dec 2024
Annual Results Snapshot (Standalone) - Mar'26
YoY Growth in year ended Mar 2026 is 56.68% vs -3.16% in Mar 2025
YoY Growth in year ended Mar 2026 is 347.89% vs -455.00% in Mar 2025
About Caprolactam Chemicals Ltd

Company Coordinates


