
Compare Captain Pipes with Similar Stocks
Stock DNA
Plastic Products - Industrial
INR 154 Cr (Micro Cap)
22.00
32
0.00%
0.73
6.92%
3.63
Total Returns (Price + Dividend) 
Captain Pipes for the last several years.
Risk Adjusted Returns v/s
Returns Beta

News
Captain Pipes Ltd Downgraded to Strong Sell Amid Weak Financials and Bearish Technicals
Captain Pipes Ltd, a micro-cap player in the Plastic Products - Industrial sector, has been downgraded from a Sell to a Strong Sell rating as of 8 June 2026. This revision reflects deteriorating fundamentals, unfavourable valuation metrics, a weakening financial trend, and increasingly bearish technical indicators, signalling heightened risk for investors.
Read full news article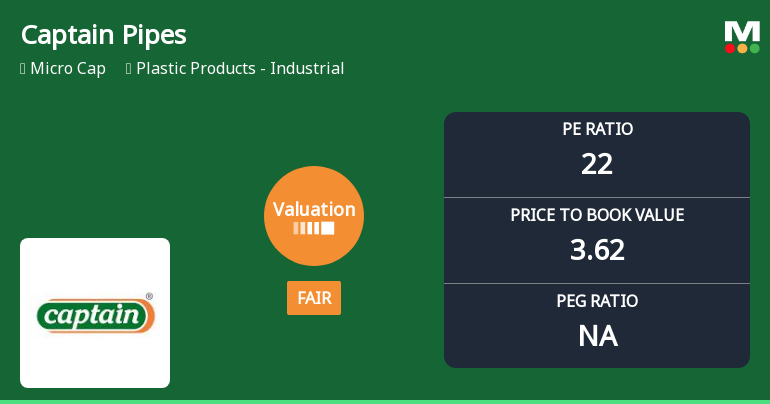
Captain Pipes Ltd Valuation Shifts to Fair; P/E and P/BV Metrics Signal Improved Price Attractiveness
Captain Pipes Ltd has seen a notable shift in its valuation parameters, moving from an expensive to a fair valuation grade, reflecting a recalibration of market expectations amid subdued price performance and mixed financial metrics. Despite this improvement, the company’s micro-cap status and a recent downgrade in its overall Mojo Grade to Sell signal ongoing investor caution.
Read full news article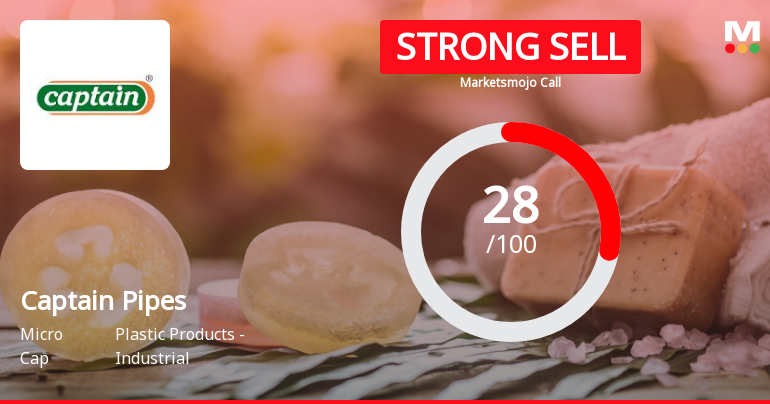
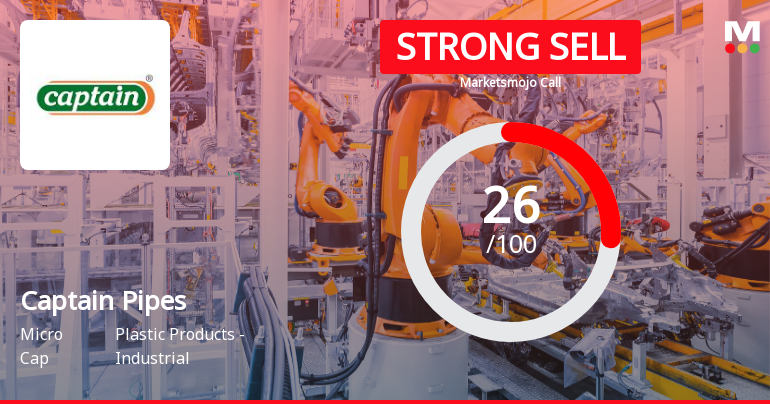
Captain Pipes Ltd is Rated Strong Sell
Captain Pipes Ltd is rated Strong Sell by MarketsMOJO. This rating was last updated on 23 May 2026, reflecting a reassessment of the stock’s outlook. However, all fundamentals, returns, and financial metrics discussed here are current as of 31 May 2026, providing investors with the latest perspective on the company’s position.
Read full news article Announcements
Compliances-Reg.24(A)-Annual Secretarial Compliance
28-May-2026 | Source : BSEAnnual secretarial compliance report
Announcement under Regulation 30 (LODR)-Newspaper Publication
25-May-2026 | Source : BSENewspaper advertisement regarding quarterly and yearly financial results
Board Meeting Outcome for Financial Results For The Quarter And Year Ended On 31St March2026
23-May-2026 | Source : BSEFinancial results for the quarter and year ended on 31st March2026
Corporate Actions

No Upcoming Board Meetings

No Dividend history available

Captain Pipes Ltd has announced 1:10 stock split, ex-date: 03 Mar 23

Captain Pipes Ltd has announced 2:1 bonus issue, ex-date: 03 Mar 23

No Rights history available
Quality key factors
Valuation key factors
Technicals key factors
 Technical Indicator Scale: Bearish, Mildly Bearish, Sideways, Mildly Bullish, Bullish Turned
 Shareholding Snapshot : Mar 2026
Shareholding Compare (%holding)
Promoters
None
Held by 0 Schemes
Held by 1 FIIs (0.06%)
Captain Polyplast Limited (17.5%)
None
31.43%
Quarterly Results Snapshot (Standalone) - Mar'26 - YoY

YoY Growth in quarter ended Mar 2026 is -14.62% vs 12.09% in Mar 2025

YoY Growth in quarter ended Mar 2026 is 0.00% vs -2.20% in Mar 2025
Half Yearly Results Snapshot (Standalone) - Sep'25
Growth in half year ended Sep 2025 is 14.47% vs -6.84% in Sep 2024
Growth in half year ended Sep 2025 is -34.98% vs 17.96% in Sep 2024
Nine Monthly Results Snapshot (Standalone) - Dec'25
YoY Growth in nine months ended Dec 2025 is 7.94% vs -3.64% in Dec 2024
YoY Growth in nine months ended Dec 2025 is -41.48% vs 14.29% in Dec 2024
Annual Results Snapshot (Standalone) - Mar'26
YoY Growth in year ended Mar 2026 is 1.28% vs 0.52% in Mar 2025
YoY Growth in year ended Mar 2026 is -33.33% vs 10.80% in Mar 2025
About Captain Pipes Ltd

Company Coordinates


