
Compare Carraro India with Similar Stocks
Dashboard
High Management Efficiency with a high ROCE of 24.57%
Strong ability to service debt as the company has a low Debt to EBITDA ratio of 1.02 times
Healthy long term growth as Operating profit has grown by an annual rate 50.60%
With a growth in Net Profit of 48.52%, the company declared Very Positive results in Mar 26
With ROCE of 27.5, it has a Attractive valuation with a 5.2 Enterprise value to Capital Employed
Stock DNA
Auto Components & Equipments
INR 3,159 Cr (Small Cap)
23.00
38
0.79%
0.11
24.40%
5.72
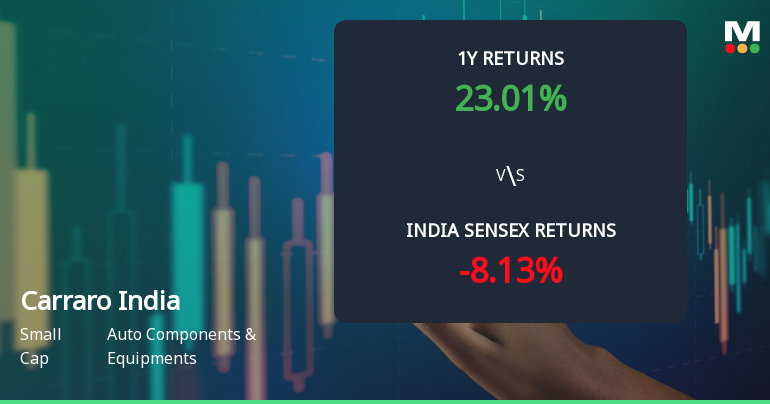
Total Returns (Price + Dividend) 
Latest dividend: 4.5 per share ex-dividend date: Sep-03-2025
Risk Adjusted Returns v/s
Returns Beta

News
Carraro India Ltd Shows Renewed Momentum Amid Mixed Technical Signals
Shares of Carraro India Ltd have exhibited a notable shift in technical momentum, moving from a sideways trend to a mildly bullish stance, supported by a strong 7.05% gain on 10 Jul 2026. This shift is underscored by mixed signals from key technical indicators such as MACD, RSI, Bollinger Bands, and moving averages, reflecting evolving investor sentiment in the auto components sector.
Read full news article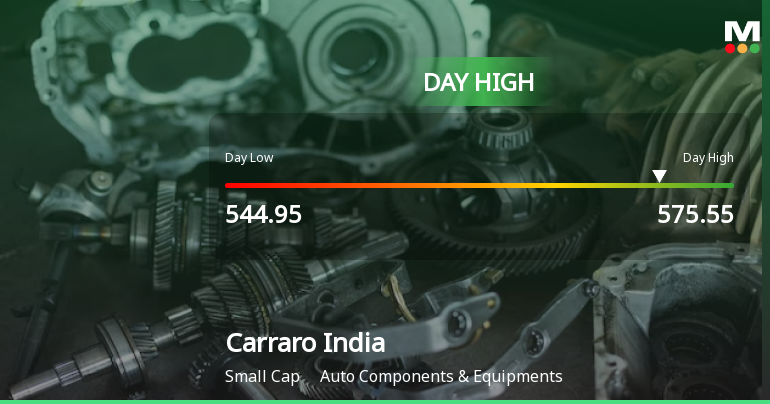
Carraro India Ltd Surges 8.66% to Day's High of Rs 575.55 — Outperforms Sector by 8.53 Percentage Points
The Sensex rose 0.71% on 09 Jul 2026, yet Carraro India Ltd outpaced the broader market with an 8.66% gain, reaching an intraday high of Rs 575.55. This 8.53 percentage-point outperformance over its Auto Components & Equipments sector peers highlights a distinctly stock-specific rally rather than a market-wide lift.
Read full news article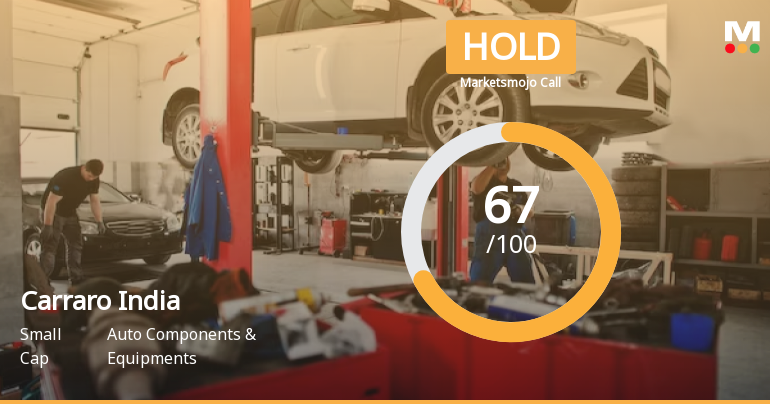
Carraro India Ltd Downgraded to Hold Amid Mixed Technical and Valuation Signals
Carraro India Ltd, a small-cap player in the Auto Components & Equipments sector, has seen its investment rating downgraded from Buy to Hold as of 8 July 2026. This adjustment follows a reassessment of the company’s technical indicators, despite robust financial performance and solid fundamentals. The downgrade reflects a more cautious stance driven primarily by technical trend shifts, while the company’s quality, valuation, and financial trends remain largely favourable.
Read full news article Announcements
Announcement under Regulation 30 (LODR)-Credit Rating
13-Jul-2026 | Source : BSECarraro India Limited has informed the Exchange about Credit Rating Revision as received from India Ratings and Research Private Limited (a Fitch Group Company) vide their communication dated 13th July 2026.
Announcement under Regulation 30 (LODR)-Credit Rating
13-Jul-2026 | Source : BSECarraro India Limited has informed the exchange about Credit Rating-Revision
Compliances-Certificate under Reg. 74 (5) of SEBI (DP) Regulations 2018
08-Jul-2026 | Source : BSECarraro India Limited has informed the Exchange about certificate under Reg 74(5) of SEBI (DP) Regulations 2018
Corporate Actions

No Upcoming Board Meetings

Carraro India Ltd has declared 45% dividend, ex-date: 03 Sep 25

No Splits history available

No Bonus history available

No Rights history available
Quality key factors
Valuation key factors
Technicals key factors
 Technical Indicator Scale: Bearish, Mildly Bearish, Sideways, Mildly Bullish, Bullish Turned
 Shareholding Snapshot : Mar 2026
Shareholding Compare (%holding)
Promoters
None
Held by 10 Schemes (11.29%)
Held by 17 FIIs (3.01%)
Carraro International S.e. (68.77%)
Hsbc Mutual Fund - Hsbc Small Cap Fund (2.79%)
9.26%
Quarterly Results Snapshot (Consolidated) - Mar'26 - QoQ

QoQ Growth in quarter ended Mar 2026 is 6.52% vs -2.84% in Dec 2025
QoQ Growth in quarter ended Mar 2026 is 48.54% vs -11.48% in Dec 2025
Half Yearly Results Snapshot (Consolidated) - Sep'25
Growth in half year ended Sep 2025 is 17.99% vs -4.83% in Sep 2024

Growth in half year ended Sep 2025 is 22.28% vs 99.48% in Sep 2024
Nine Monthly Results Snapshot (Consolidated) - Dec'25
YoY Growth in nine months ended Dec 2025 is 20.94% vs -13.04% in Dec 2024
YoY Growth in nine months ended Dec 2025 is 38.00% vs -3.32% in Dec 2024
Annual Results Snapshot (Consolidated) - Mar'26
YoY Growth in year ended Mar 2026 is 24.78% vs 1.04% in Mar 2025
YoY Growth in year ended Mar 2026 is 48.16% vs 40.90% in Mar 2025
About Carraro India Ltd

Company Coordinates


