
Compare Cartrade Tech with Similar Stocks
Dashboard
The company is Net-Debt Free
Healthy long term growth as Net Sales has grown by an annual rate of 25.64% and Operating profit at 35.86%
The company has declared Positive results for the last 16 consecutive quarters
With ROE of 9.2, it has a Very Expensive valuation with a 4.5 Price to Book Value
High Institutional Holdings at 72.21%
Consistent Returns over the last 3 years
Stock DNA
E-Retail/ E-Commerce
INR 11,405 Cr (Small Cap)
49.00
20
0.00%
-0.32
9.19%
4.60
Total Returns (Price + Dividend) 
Cartrade Tech for the last several years.
Risk Adjusted Returns v/s
Returns Beta

News
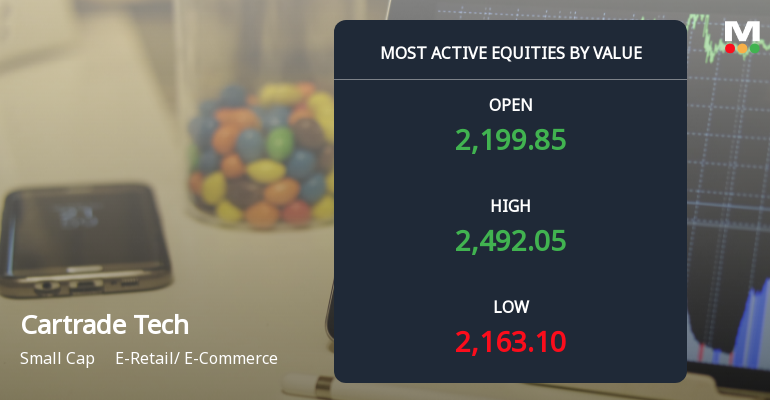
Cartrade Tech Ltd Surges on High-Value Trading and Institutional Interest
Cartrade Tech Ltd, a prominent player in the E-Retail and E-Commerce sector, witnessed a remarkable surge in trading activity on 10 June 2026, driven by robust institutional interest and significant value turnover. The stock outperformed its sector and broader market indices, reflecting renewed investor confidence amid improving fundamentals and technical momentum.
Read full news article
Cartrade Tech Ltd Surges 7.86% to Day's High of Rs 2336 — Outperforms Sector by 6.46 Percentage Points
The Sensex rose 0.69% on 10 Jun 2026, yet Cartrade Tech Ltd outpaced the broader market with a robust 7.86% gain, touching an intraday high of Rs 2336. This 6.46-percentage-point outperformance over its E-Retail/ E-Commerce sector peers signals a distinctly stock-specific rally rather than a market-wide lift.
Read full news article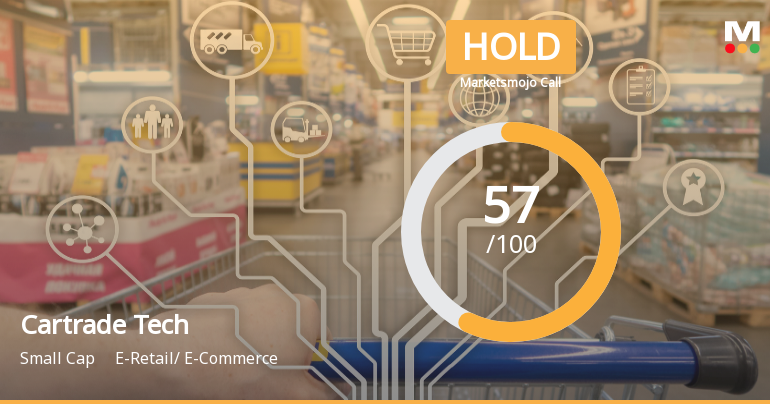
Cartrade Tech Ltd Upgraded to Hold as Technicals Improve and Financials Strengthen
Cartrade Tech Ltd has seen its investment rating upgraded from Sell to Hold, driven primarily by a shift in technical indicators alongside robust financial performance and valuation metrics. The company’s improved technical trend, solid financial growth, and stable quality parameters have collectively influenced this positive reassessment.
Read full news article Announcements
Announcement under Regulation 30 (LODR)-Allotment of ESOP / ESPS
11-Jun-2026 | Source : BSEAttached
Announcement under Regulation 30 (LODR)-Press Release / Media Release
05-Jun-2026 | Source : BSEAttached
Announcement under Regulation 30 (LODR)-Analyst / Investor Meet - Intimation
03-Jun-2026 | Source : BSEAttached
Corporate Actions

No Upcoming Board Meetings

No Dividend history available

No Splits history available

No Bonus history available

No Rights history available
Quality key factors
Valuation key factors
Technicals key factors
 Technical Indicator Scale: Bearish, Mildly Bearish, Sideways, Mildly Bullish, Bullish Turned
 Shareholding Snapshot : Mar 2026
Shareholding Compare (%holding)
FIIs
None
Held by 20 Schemes (9.89%)
Held by 240 FIIs (60.14%)
None
Macritchie Investments Pte Ltd (9.05%)
15.37%
Quarterly Results Snapshot (Consolidated) - Mar'26 - QoQ

QoQ Growth in quarter ended Mar 2026 is -3.11% vs 8.41% in Dec 2025

QoQ Growth in quarter ended Mar 2026 is 15.66% vs -6.37% in Dec 2025
Half Yearly Results Snapshot (Consolidated) - Sep'25
Growth in half year ended Sep 2025 is 23.91% vs 43.50% in Sep 2024
Growth in half year ended Sep 2025 is 104.51% vs 213.18% in Sep 2024
Nine Monthly Results Snapshot (Consolidated) - Dec'25
YoY Growth in nine months ended Dec 2025 is 22.07% vs 36.93% in Dec 2024
YoY Growth in nine months ended Dec 2025 is 70.63% vs 1,229.32% in Dec 2024
Annual Results Snapshot (Consolidated) - Mar'26
YoY Growth in year ended Mar 2026 is 21.48% vs 30.92% in Mar 2025
YoY Growth in year ended Mar 2026 is 65.61% vs 841.61% in Mar 2025
About Cartrade Tech Ltd

Company Coordinates


