Castora Agri Com

  • Market Cap: Micro Cap
  • Industry: Iron & Steel Products
  • ISIN: INE641H01018
  • NSEID:
  • BSEID: 531913
INR
11.55
0.00 (0.00%)
BSENSE

Sep 01, 03:30 PM

BSE+NSE Vol: 4.85 k

  • Price Points
  • Score
  • Mojo Parameters
  • Total Return
  • News and Corporate Actions
  • Key factors
  • Shareholding
  • Financials
  • CompanyCV
stock-summaryPrice Point
High/Low

1Day

52 Week

Valuation
Technical
Day's Volume

CASH

4.85 k (23.84%) Volume

Shareholding (Jun 2026)

FII

0.00%

Held by 0 FIIs

DII

0.00%

Held by 0 DIIs

Promoter

5.37%

Why is Castora Agri Commodities Ltd falling/rising?

02-Sep-2026

As of 01-Sep, Castora Agri Commodities Ltd's stock price is rising to 11.55, reflecting a 5.0% increase due to strong relative performance, increased investor participation, and impressive annual returns of 58.44%. Despite some long-term concerns, current market sentiment remains favorable.

As of 01-Sep, Castora Agri Commodities Ltd's stock price is rising, currently at 11.55, reflecting a change of 0.55 or 5.0% increase. This upward movement can be attributed to several factors. Firstly, the stock has outperformed its sector by 4.7% today, indicating strong relative performance. Additionally, there has been a notable increase in investor participation, with a delivery volume of 3.49 k on August 31, which is up by 7.49% compared to the 5-day average. <BR><BR>Moreover, the stock has shown impressive returns over the past year, with a gain of 58.44%, significantly higher than the broader market's return of 2.32%. This performance is supported by positive quarterly results reported on June 26, where key financial metrics such as PBDIT, PBT, and PAT all reached their highest levels at Rs 0.12 crore. <BR><BR>Despite some concerns regarding long-term fundamental strength, such as a low Return on Capital Employed (ROCE) of -2.6 and a high Debt to EBITDA ratio, the current market sentiment appears to be favorable, bolstered by the stock's historical valuation discount compared to peers. Overall, these factors contribute to the stock's rising price.

View full answer

Who are in the management team of Castora Agri Com?

01-Sep-2026

The management team of Castora Agri Com consists of Prabhubhai L Patel (Whole-time Director), Kundanben Patel (Managing Director), and independent directors Rakeshkumar Motilal Moghariya, Mukesh Jani, and Prafful Burad.

The management team of Castora Agri Com includes the following individuals:<BR><BR>1. Prabhubhai L Patel - Whole-time Director<BR>2. Kundanben Patel - Managing Director<BR>3. Rakeshkumar Motilal Moghariya - Independent Director<BR>4. Mukesh Jani - Independent Director<BR>5. Prafful Burad - Independent Director<BR><BR>If you need more details about their roles or responsibilities, feel free to ask!

View full answer

What does Castora Agri Com do?

01-Sep-2026

Castora Agri Commodities Ltd manufactures iron and steel products and operates in the Micro Cap category. As of June 2026, it reported net sales of 10 Cr and a market cap of INR 5 Cr.

Overview: <BR>Castora Agri Commodities Ltd is engaged in the manufacturing of iron and steel products and operates within the Micro Cap category in the Iron & Steel Products industry.<BR><BR>History: <BR>The company was established in 1994 and converted into a Public Limited Company in 1995. The latest quarterly results reported net sales and net profit for June 2026.<BR><BR>Financial Snapshot: <BR>Most recent Net Sales: 10 Cr (Quarterly Results - Jun 2026) <BR>Most recent Net Profit: 0 Cr (Quarterly Results - Jun 2026) <BR>Market-cap value: INR 5 Cr (Micro Cap)<BR><BR>Key Metrics: <BR>P/E: 22.00 <BR>Industry P/E: 25 <BR>Dividend Yield: 0.00% <BR>Debt Equity: 0.71 <BR>Return on Equity: 25.00% <BR>Price to Book: 5.41 <BR><BR>Contact Details: <BR>Address: B/701 Nirman Complex, B/H Navrangpura Bus Stand Ahmedabad Gujarat : 380009 <BR>Email: gisco_guj@yahoo.com <BR>Website: http://www.gopaliron.in

View full answer

Who are the peers of the Castora Agri Com?

01-Sep-2026

Peers of Castora Agri Com include Sh. Steel Wire, Monind, AFLOAT Enterpris, Mahalaxmi Seam., Shree Precoated, MFS Intercorp, Vallabh Steels, Aditya Ispat, and Elango Industrie. Castora Agri Com has a 1-year return of 49.66%, significantly higher than its peers, while management and growth risks are generally below average among several peers.

Peers: The peers of Castora Agri Com are Sh. Steel Wire, Monind, AFLOAT Enterpris, Mahalaxmi Seam., Shree Precoated, MFS Intercorp, Vallabh Steels, Aditya Ispat, and Elango Industrie.<BR><BR>Quality Snapshot: Below Average management risk is observed at Sh. Steel Wire, AFLOAT Enterpris, Mahalaxmi Seam., Aditya Ispat, Castora Agri Com, and Elango Industrie, while Average management risk is found at MFS Intercorp. Monind, Shree Precoated, and Vallabh Steels do not qualify for management risk assessment. Growth is Average at Castora Agri Com, while Below Average growth is noted at Sh. Steel Wire, AFLOAT Enterpris, Mahalaxmi Seam., MFS Intercorp, Aditya Ispat, and Elango Industrie. Monind, Shree Precoated, and Vallabh Steels do not qualify for growth assessment. Capital Structure is Good at Sh. Steel Wire and AFLOAT Enterpris, while Below Average is seen at Mahalaxmi Seam., MFS Intercorp, Aditya Ispat, Castora Agri Com, and Elango Industrie, with Monind, Shree Precoated, and Vallabh Steels not qualifying.<BR><BR>Return Snapshot: The peer with the highest 1-year return is Mahalaxmi Seam. at 28.21%, while Monind has the lowest at N/A, and Castora Agri Com's 1-year return is 49.66%, which is significantly higher than all peers. Additionally, MFS Intercorp and Vallabh Steels have negative six-month returns.

View full answer

How big is Castora Agri Com?

01-Sep-2026

As of 31st August, Castora Agri Commodities Ltd has a market capitalization of 5.00 Cr, with net sales of 9.99 Cr and a net profit of 0.13 Cr for the latest four quarters. Shareholder's funds are 0.89 Cr and total assets amount to 2.76 Cr as of March 2025.

As of 31st August, Castora Agri Commodities Ltd has a market capitalization of 5.00 Cr, categorizing it as a Micro Cap company.<BR><BR>For the latest four quarters, the company reported net sales of 9.99 Cr and a net profit of 0.13 Cr.<BR><BR>The latest annual period for the balance sheet is March 2025, with shareholder's funds amounting to 0.89 Cr and total assets of 2.76 Cr.

View full answer

Should I buy, sell or hold Gopal Iron & Steels Co.(Gujarat) Ltd?

16-Aug-2026

When is the next results date for Gopal Iron & Steels Co.(Gujarat) Ltd?

07-Aug-2026

The next results date for Gopal Iron & Steels Co. (Gujarat) Ltd is 13 August 2026.

The next results date for Gopal Iron & Steels Co.(Gujarat) Ltd is scheduled for 13 August 2026.

View full answer

Are Gopal Iron & Steels Co.(Gujarat) Ltd latest results good or bad?

31-Jan-2026

Gopal Iron & Steels Co. (Gujarat) Ltd's latest results show a slight profit of ₹0.07 crores, but this is on very low revenue and reflects a significant year-on-year decline. Overall, the company's erratic performance, declining revenues, and reduced promoter holding indicate a troubling outlook for investors.

The latest results for Gopal Iron & Steels Co. (Gujarat) Ltd present a mixed picture, but overall, they lean towards the negative side. In Q2 FY26, the company reported a net profit of ₹0.07 crores, which is an improvement from a loss in the previous quarter. However, this profit was achieved on very low revenue of just ₹0.10 crores, reflecting a significant year-on-year decline of 58.33% from ₹0.24 crores in the same quarter last year.<BR><BR>While the operating margin of 70.00% appears impressive, it is important to note that it is based on minimal revenue, raising concerns about the sustainability of such margins. The company's financial performance has been highly erratic, with zero revenue reported in the previous quarter, indicating severe operational challenges.<BR><BR>Moreover, the sharp decline in promoter holding from 10.79% to just 5.37% signals a lack of confidence from insiders, which is concerning for potential investors. The absence of institutional participation further compounds the credibility issues facing the company.<BR><BR>In summary, while there is a slight return to profitability, the overall operational volatility, declining revenues, and significant insider selling suggest that the results are more troubling than encouraging. Investors should approach with caution given the company's precarious position in a highly competitive sector.

View full answer

Is Gopal Iron Stl. overvalued or undervalued?

28-Nov-2025

As of November 27, 2025, Gopal Iron Steel is considered overvalued with a valuation grade of expensive, highlighted by a Price to Book Value of 5.73, a significantly skewed PE ratio, and a lack of growth potential compared to peers like JSW Steel and Tata Steel, despite recent short-term stock performance.

As of 27 November 2025, the valuation grade for Gopal Iron Steel has moved from very expensive to expensive. The company is currently considered overvalued based on its financial metrics and peer comparisons. Key ratios include a Price to Book Value of 5.73, an EV to EBIT of 6.24, and a ROCE of only 1.41%. <BR><BR>In comparison to its peers, Gopal Iron Steel's PE ratio is significantly skewed at -413130585320782080.00, while JSW Steel and Tata Steel have PE ratios of 46.27 and 28.19, respectively, indicating a more favorable valuation. Additionally, Gopal Iron's PEG ratio is 0.00, contrasting sharply with Tata Steel's PEG of 0.23, which suggests that Gopal Iron Steel is not only overvalued but also lacks growth potential relative to its peers. Notably, the company's stock has outperformed the Sensex in various time frames, including a 57.78% return over the past week, which may reflect short-term market sentiment rather than long-term value.

View full answer

How has been the historical performance of Gopal Iron Stl.?

20-Nov-2025

Gopal Iron Stl. has experienced fluctuating financial performance, with net sales decreasing to 3.16 Cr in Mar'25 from 4.19 Cr in Mar'24, and continued losses in profitability, reflected in a negative operating profit and EPS of -0.04. Despite some improvements in sales, the company faces ongoing challenges in profitability and asset management.

Answer:<BR>The historical performance of Gopal Iron Stl. shows significant fluctuations in its financial metrics over the years.<BR><BR>Breakdown:<BR>Gopal Iron Stl. reported net sales of 3.16 Cr in Mar'25, a decrease from 4.19 Cr in Mar'24 and an increase from 1.10 Cr in Mar'23. The total operating income followed a similar trend, with 3.16 Cr in Mar'25 compared to 4.19 Cr in Mar'24. The raw material cost was 2.97 Cr in Mar'25, down from 4.13 Cr in Mar'24. The company experienced total expenditure of 3.18 Cr in Mar'25, a decline from 4.25 Cr in Mar'24. Operating profit (PBDIT) was slightly negative at -0.02 Cr in Mar'25, improving from -0.06 Cr in Mar'24. Profit before tax also showed a loss of -0.02 Cr in Mar'25, down from a profit of 0.06 Cr in Mar'24. The profit after tax mirrored this trend with a loss of -0.02 Cr in Mar'25, compared to a profit of 0.06 Cr in Mar'24. The earnings per share (EPS) fell to -0.04 in Mar'25 from 0.12 in Mar'24. On the balance sheet, total liabilities were 2.76 Cr in Mar'25, slightly up from 2.72 Cr in Mar'24, while total assets remained stable at 2.76 Cr. The company reported a book value per share of 1.81 in Mar'25, down from 1.85 in Mar'24. Overall, Gopal Iron Stl. has shown a mixed performance with some improvements in sales but continued challenges in profitability and asset management.

View full answer

What is the technical trend for Gopal Iron Stl.?

09-Jun-2025

As of June 2, 2025, Gopal Iron Stl. shows a mildly bullish trend, supported by daily moving averages and a bullish weekly MACD, despite mixed signals from the monthly MACD and a mildly bearish weekly Dow Theory.

As of 2 June 2025, the technical trend for Gopal Iron Stl. has changed from bullish to mildly bullish. The weekly MACD remains bullish, while the monthly MACD is mildly bearish, indicating mixed signals across time frames. The daily moving averages are mildly bullish, supporting the short-term positive outlook. However, the weekly KST is bullish, contrasting with the monthly bearish stance, and the Dow Theory suggests a mildly bearish trend on the weekly chart. Overall, the current technical stance is mildly bullish, driven primarily by the daily moving averages and the weekly MACD.

View full answer

Who are the top shareholders of the Gopal Iron Stl.?

06-Jun-2025

The top shareholders of Gopal Iron Stl. are Vithalbhai P Patel, the largest promoter with 4.07%, and Ewart Promoter Holdings Private Limited, the largest public shareholder with 3.77%. Individual investors hold a significant 82.7% of the shares, with no pledged promoter holdings or mutual fund/foreign institutional investor involvement.

The top shareholders of Gopal Iron Stl. include Vithalbhai P Patel, who is the promoter with the highest holding at 4.07%. The highest public shareholder is Ewart Promoter Holdings Private Limited, holding 3.77%. Additionally, individual investors collectively hold a significant portion of the company, accounting for 82.7% of the shares. There are no pledged promoter holdings, and the company does not have any mutual fund or foreign institutional investor holdings.

View full answer

Has Gopal Iron Stl. declared dividend?

06-Jun-2025

No Dividend History Available

iScoreScore
Click here to find our call on this stock
Strong Sell
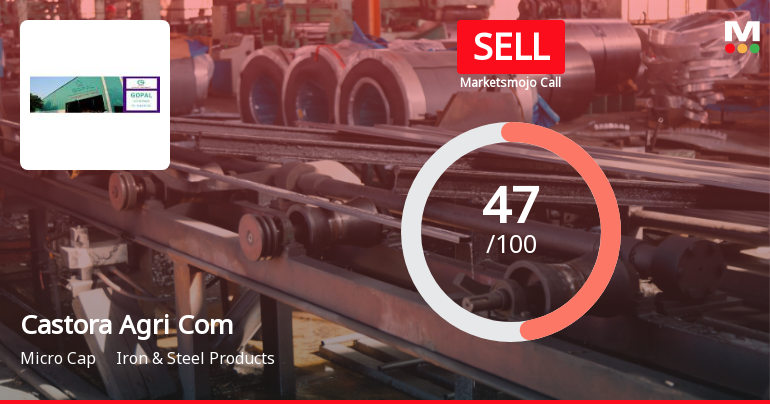
Sell
Hold
Buy
Strong Buy

Dashboard

1

Weak Long Term Fundamental Strength with an average Return on Capital Employed (ROCE) of 2.18%

  • Poor long term growth as Operating profit has grown by an annual rate 6.03% of over the last 5 years
  • Low ability to service debt as the company has a high Debt to EBITDA ratio of -0.73 times
stock-summaryMojo Parameters

Mojo Parameters

Loading Valuation Snapshot...

Stock DNA

stock-summary
Industry

Iron & Steel Products

stock-summary
Market cap

INR 5 Cr (Micro Cap)

stock-summary
P/E

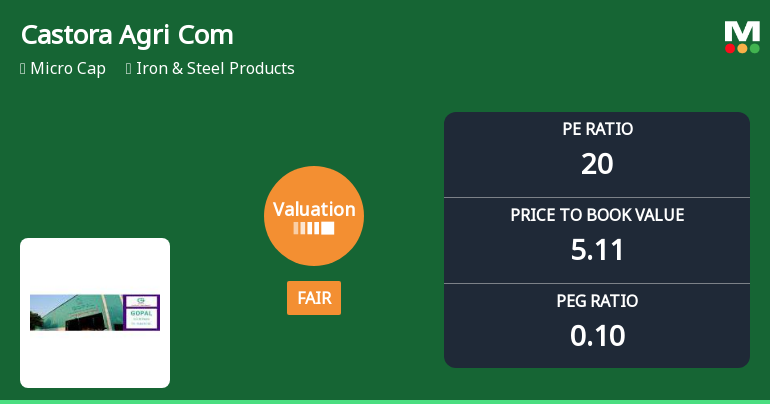
23.00

stock-summary
Industry P/E

9

stock-summary
Dividend Yield

0.00%

stock-summary
Debt Equity

0.71

stock-summary
Return on Equity

25.00%

stock-summary
Price to Book

5.41

Revenue and Profits:
Net Sales:
10 Cr
(Quarterly Results - Jun 2026)
Net Profit:
0 Cr
stock-summaryTotal Returns
Total Returns (Price + Dividend) stock-summary
Dividend Yield (0%)
TimePeriod
Price Return
Dividend Return
Total Return
3 Months
0%
0%
0.0%
6 Months
-1.11%
0%
-1.11%
1 Year
64.76%
0%
64.76%
2 Years
52.78%
0%
52.78%
3 Years
5.96%
0%
5.96%
4 Years
83.33%
0%
83.33%
5 Years
151.63%
0%
151.63%

Castora Agri Com for the last several years.

Risk Adjusted Returns v/s stock-summary
Returns Beta
Icon
Beta has not been calculated since enough price history is not available
stock-summaryNews & Corporate Actions

News

Gopal Iron & Steels Falls 3.75% Amid Downgrade and Valuation Shifts: 3 Key Factors Driving the Week

Announcements stock-summary

Announcement under Regulation 30 (LODR)-Newspaper Publication

15-Aug-2026 | Source : BSE

Enclosed herewith copy of advertisement given in newspaper of unaudited financial results for the quarter ended June 30 2026.

Unaudited Financial Results Of The Company For The Quarter Ended June 30 2026.

13-Aug-2026 | Source : BSE

Pursuant to Regulation 33 of SEBI Listing Regulations 2015 please find the enclosed the unaudited financial results of the company for the quarter ended June 30 2026 along with the Limited Review Report.

Board Meeting Outcome for Consideration And Approval Of Unaudited Financial Results For The Quarter Ended June 30 2026.

13-Aug-2026 | Source : BSE

Pursuant to Regulation 30 of SEBI (Listing Obligations and Disclosure Requirements) Regulations 2015 the Stock exchange is hereby informed that the Board of Directors of the Company at its meeting held today i.e. August 13 2026 at the registered office of the Company has inter alia considered and approved the Unaudited Financial Results of the Company for the quarter ended June 30 2026 along with the Limited Review Report thereon.

Corporate Actions stock-summary

stock-summary
BOARD MEETING

No Upcoming Board Meetings

stock-summary
DIVIDEND

No Dividend history available

stock-summary
SPLITS

No Splits history available

stock-summary
BONUS

No Bonus history available

stock-summary
RIGHTS

No Rights history available

stock-summaryKey Factors

Quality key factors stock-summary

Factor
Value
Sales Growth (5y)
61.51%
EBIT Growth (5y)
6.03%
EBIT to Interest (avg)
-0.82
Debt to EBITDA (avg)
Negative Net Debt
Net Debt to Equity (avg)
0.71
Sales to Capital Employed (avg)
1.72
Tax Ratio
0
Dividend Payout Ratio
0
Pledged Shares
0
Institutional Holding
0
ROCE (avg)
-18.87%
ROE (avg)
6.00%

Valuation key factors

Factor
Value
P/E Ratio
23
Industry P/E
9
Price to Book Value
5.68
EV to EBIT
6.39
EV to EBITDA
6.39
EV to Capital Employed
4.10
EV to Sales
0.64
PEG Ratio
0.11
Dividend Yield
NA
ROCE (Latest)
-2.56%
ROE (Latest)
25.00%

Technicals key factors

Indicator
Weekly
Monthly
MACD
Bearish
Bullish
RSI
No Signal
No Signal
Bollinger Bands
Mildly Bearish
Bullish
Moving Averages
Mildly Bullish (Daily)
KST
Bearish
Bullish
Dow Theory
Mildly Bullish
No Trend
stock-summary Technical Indicator Scale: Bearish, Mildly Bearish, Sideways, Mildly Bullish, Bullish  Turned 
stock-summaryShareholding
Shareholding Snapshot : Jun 2026stock-summary
Shareholding Compare (%holding) stock-summary
Majority shareholders

Non Institution

Pledged Promoter Holdings

None

Mutual Funds

Held by 0 Schemes

FIIs

Held by 0 FIIs

Promoter with highest holding

Vithalbhai P Patel (4.07%)

Highest Public shareholder

Vkr Commercial Llp (18.89%)

Individual Investors Holdings

71.59%

stock-summaryFinancial
[
  {
    "link": "quarterly",
    "btn_text": "All Quarterly Results",
    "header": "Quarterly Results Snapshot (Standalone) - Jun'26 - QoQ",
    "rhs": [
      {
        "prefix": "Net Sales ",
        "suffix": "QoQ Growth in quarter ended Jun 2026 is 8,790.91% vs 0.00% in Mar 2026",
        "dir": 1
      },
      {
        "prefix": "Standalone Net Profit ",
        "suffix": "QoQ Growth in quarter ended Jun 2026 is 20.00% vs 162.50% in Mar 2026",
        "dir": -1
      }
    ],
    "table": {
      "header": [
        "Jun'26",
        "Mar'26",
        "Change(%)"
      ],
      "body": [
        {
          "field": "Net Sales",
          "val1": "9.78",
          "val2": "0.11",
          "chgp": "8,790.91%",
          "chgp_class": "positive"
        },
        {
          "field": "Operating Profit (PBDIT) excl Other Income",
          "val1": "0.12",
          "val2": "0.10",
          "chgp": "20.00%",
          "chgp_class": "positive"
        },
        {
          "field": "Interest",
          "val1": "0.00",
          "val2": "0.00",
          "chgp": "",
          "chgp_class": "neutral"
        },
        {
          "field": "Exceptional Items",
          "val1": "0.00",
          "val2": "0.00",
          "chgp": "",
          "chgp_class": "neutral"
        },
        {
          "field": "Standalone Net Profit",
          "val1": "0.12",
          "val2": "0.10",
          "chgp": "20.00%",
          "chgp_class": "positive"
        },
        {
          "field": "Operating Profit Margin (Excl OI)",
          "val1": "1.23%",
          "val2": "90.91%",
          "chgp": "-89.68%",
          "chgp_class": "negative"
        }
      ]
    }
  },
  {
    "link": "half-yearly",
    "btn_text": "All Half Yearly Results",
    "header": "Half Yearly Results Snapshot (Standalone) - Sep'25",
    "rhs": [
      {
        "prefix": "Net Sales ",
        "suffix": " Growth in half year ended Sep 2025 is -94.38% vs -35.27% in Sep 2024",
        "dir": -1
      },
      {
        "prefix": "Standalone Net Profit ",
        "suffix": " Growth in half year ended Sep 2025 is 300.00% vs -120.00% in Sep 2024",
        "dir": 1
      }
    ],
    "table": {
      "header": [
        "Sep'25",
        "Sep'24",
        "Change(%)"
      ],
      "body": [
        {
          "field": "Net Sales",
          "val1": "0.10",
          "val2": "1.78",
          "chgp": "-94.38%",
          "chgp_class": "negative"
        },
        {
          "field": "Operating Profit (PBDIT) excl Other Income",
          "val1": "0.02",
          "val2": "-0.01",
          "chgp": "300.00%",
          "chgp_class": "positive"
        },
        {
          "field": "Interest",
          "val1": "0.00",
          "val2": "0.00",
          "chgp": "",
          "chgp_class": "neutral"
        },
        {
          "field": "Exceptional Items",
          "val1": "0.00",
          "val2": "0.00",
          "chgp": "",
          "chgp_class": "neutral"
        },
        {
          "field": "Standalone Net Profit",
          "val1": "0.02",
          "val2": "-0.01",
          "chgp": "300.00%",
          "chgp_class": "positive"
        },
        {
          "field": "Operating Profit Margin (Excl OI)",
          "val1": "20.00%",
          "val2": "-0.56%",
          "chgp": "20.56%",
          "chgp_class": "positive"
        }
      ]
    }
  },
  {
    "link": "nine-monthly",
    "btn_text": "All Nine Monthly Results",
    "header": "Nine Monthly Results Snapshot (Standalone) - Dec'25",
    "rhs": [
      {
        "prefix": "Net Sales ",
        "suffix": "YoY Growth in nine months ended Dec 2025 is -95.92% vs -37.18% in Dec 2024",
        "dir": -1
      },
      {
        "prefix": "Standalone Net Profit ",
        "suffix": "YoY Growth in nine months ended Dec 2025 is -1,500.00% vs -80.00% in Dec 2024",
        "dir": -1
      }
    ],
    "table": {
      "header": [
        "Dec'25",
        "Dec'24",
        "Change(%)"
      ],
      "body": [
        {
          "field": "Net Sales",
          "val1": "0.10",
          "val2": "2.45",
          "chgp": "-95.92%",
          "chgp_class": "negative"
        },
        {
          "field": "Operating Profit (PBDIT) excl Other Income",
          "val1": "-0.14",
          "val2": "0.02",
          "chgp": "-800.00%",
          "chgp_class": "negative"
        },
        {
          "field": "Interest",
          "val1": "0.00",
          "val2": "0.00",
          "chgp": "",
          "chgp_class": "neutral"
        },
        {
          "field": "Exceptional Items",
          "val1": "0.00",
          "val2": "0.00",
          "chgp": "",
          "chgp_class": "neutral"
        },
        {
          "field": "Standalone Net Profit",
          "val1": "-0.14",
          "val2": "0.01",
          "chgp": "-1,500.00%",
          "chgp_class": "negative"
        },
        {
          "field": "Operating Profit Margin (Excl OI)",
          "val1": "-140.00%",
          "val2": "0.82%",
          "chgp": "-140.82%",
          "chgp_class": "negative"
        }
      ]
    }
  },
  {
    "link": "annual",
    "btn_text": "All Annual Results",
    "header": "Annual Results Snapshot (Standalone) - Mar'26",
    "rhs": [
      {
        "prefix": "Net Sales ",
        "suffix": "YoY Growth in year ended Mar 2026 is -93.35% vs -24.58% in Mar 2025",
        "dir": -1
      },
      {
        "prefix": "Standalone Net Profit ",
        "suffix": "YoY Growth in year ended Mar 2026 is -100.00% vs -133.33% in Mar 2025",
        "dir": 1
      }
    ],
    "table": {
      "header": [
        "Mar'26",
        "Mar'25",
        "Change(%)"
      ],
      "body": [
        {
          "field": "Net Sales",
          "val1": "0.21",
          "val2": "3.16",
          "chgp": "-93.35%",
          "chgp_class": "negative"
        },
        {
          "field": "Operating Profit (PBDIT) excl Other Income",
          "val1": "0.01",
          "val2": "-0.02",
          "chgp": "150.00%",
          "chgp_class": "positive"
        },
        {
          "field": "Interest",
          "val1": "0.05",
          "val2": "0.00",
          "chgp": "",
          "chgp_class": "neutral"
        },
        {
          "field": "Exceptional Items",
          "val1": "0.00",
          "val2": "0.00",
          "chgp": "",
          "chgp_class": "neutral"
        },
        {
          "field": "Standalone Net Profit",
          "val1": "-0.04",
          "val2": "-0.02",
          "chgp": "-100.00%",
          "chgp_class": "negative"
        },
        {
          "field": "Operating Profit Margin (Excl OI)",
          "val1": "4.76%",
          "val2": "-0.63%",
          "chgp": "5.39%",
          "chgp_class": "positive"
        }
      ]
    }
  }
]

Quarterly Results Snapshot (Standalone) - Jun'26 - QoQstock-summary

Jun'26
Mar'26
Change(%)
Net Sales
9.78
0.11
8,790.91%
Operating Profit (PBDIT) excl Other Income
0.12
0.10
20.00%
Interest
0.00
0.00
Exceptional Items
0.00
0.00
Standalone Net Profit
0.12
0.10
20.00%
Operating Profit Margin (Excl OI)
1.23%
90.91%
-89.68%
Values in Rs Cr.
Direction Arrows
Net Sales

QoQ Growth in quarter ended Jun 2026 is 8,790.91% vs 0.00% in Mar 2026

Direction Arrows
Standalone Net Profit

QoQ Growth in quarter ended Jun 2026 is 20.00% vs 162.50% in Mar 2026

Half Yearly Results Snapshot (Standalone) - Sep'25stock-summary

Sep'25
Sep'24
Change(%)
Net Sales
0.10
1.78
-94.38%
Operating Profit (PBDIT) excl Other Income
0.02
-0.01
300.00%
Interest
0.00
0.00
Exceptional Items
0.00
0.00
Standalone Net Profit
0.02
-0.01
300.00%
Operating Profit Margin (Excl OI)
20.00%
-0.56%
20.56%
Values in Rs Cr.
Direction Arrows
Net Sales

Growth in half year ended Sep 2025 is -94.38% vs -35.27% in Sep 2024

Direction Arrows
Standalone Net Profit

Growth in half year ended Sep 2025 is 300.00% vs -120.00% in Sep 2024

Nine Monthly Results Snapshot (Standalone) - Dec'25stock-summary

Dec'25
Dec'24
Change(%)
Net Sales
0.10
2.45
-95.92%
Operating Profit (PBDIT) excl Other Income
-0.14
0.02
-800.00%
Interest
0.00
0.00
Exceptional Items
0.00
0.00
Standalone Net Profit
-0.14
0.01
-1,500.00%
Operating Profit Margin (Excl OI)
-140.00%
0.82%
-140.82%
Values in Rs Cr.
Direction Arrows
Net Sales

YoY Growth in nine months ended Dec 2025 is -95.92% vs -37.18% in Dec 2024

Direction Arrows
Standalone Net Profit

YoY Growth in nine months ended Dec 2025 is -1,500.00% vs -80.00% in Dec 2024

Annual Results Snapshot (Standalone) - Mar'26stock-summary

Mar'26
Mar'25
Change(%)
Net Sales
0.21
3.16
-93.35%
Operating Profit (PBDIT) excl Other Income
0.01
-0.02
150.00%
Interest
0.05
0.00
Exceptional Items
0.00
0.00
Standalone Net Profit
-0.04
-0.02
-100.00%
Operating Profit Margin (Excl OI)
4.76%
-0.63%
5.39%
Values in Rs Cr.
Direction Arrows
Net Sales

YoY Growth in year ended Mar 2026 is -93.35% vs -24.58% in Mar 2025

Direction Arrows
Standalone Net Profit

YoY Growth in year ended Mar 2026 is -100.00% vs -133.33% in Mar 2025

stock-summaryCompany CV
About Castora Agri Commodities Ltd stock-summary
stock-summary
Castora Agri Commodities Ltd
Micro Cap
Iron & Steel Products
Gopal Iron & Steels Co. (Gujarat) Limited (GISCO) was established in 1994. The Company was converted into a Public Limited Company in 1995 and since then it is known as Gopal Iron & Steels Co. (Gujarat) Limited. Promoted by Harsh Bhaveshbhai Patel, the Company is engaged in the manufacturing of SS/MS Bars, MS Sections, ERW Pipes and other iron and steel items. Over the years, GISCO has been continuously upgrading with latest technology and infrastructure.
Company Coordinates stock-summary
Company Details
B/701 Nirman Complex, B/H Navrangpura Bus Stand Ahmedabad Gujarat : 380009
stock-summary
Tel:
stock-summary
gisco_guj@yahoo.com
Registrar Details
Bigshare Services Pvt Ltd , E-2 , Ansa Industrial Estate, Saki Vihar Road, Saki Naka, Andheri (E), Mumbai