
Compare CCL Internationa with Similar Stocks
Dashboard
Weak Long Term Fundamental Strength with a -180.27% CAGR growth in Operating Profits over the last 5 years
- Company's ability to service its debt is weak with a poor EBIT to Interest (avg) ratio of 0.08
- The company has been able to generate a Return on Equity (avg) of 1.58% signifying low profitability per unit of shareholders funds
- PBT LESS OI(Q) At Rs 0.17 cr has Fallen at -94.46%
- PAT(Q) At Rs 1.47 cr has Fallen at -51.8%
- NON-OPERATING INCOME(Q) is 91.63 % of Profit Before Tax (PBT)
Risky - Negative Operating Profits
Underperformed the market in the last 1 year
Total Returns (Price + Dividend) 
Latest dividend: 0.04 per share ex-dividend date: Sep-18-2015
Risk Adjusted Returns v/s
Returns Beta

News
CCL International Ltd Valuation Shifts Signal Elevated Risk Amid Construction Sector Challenges
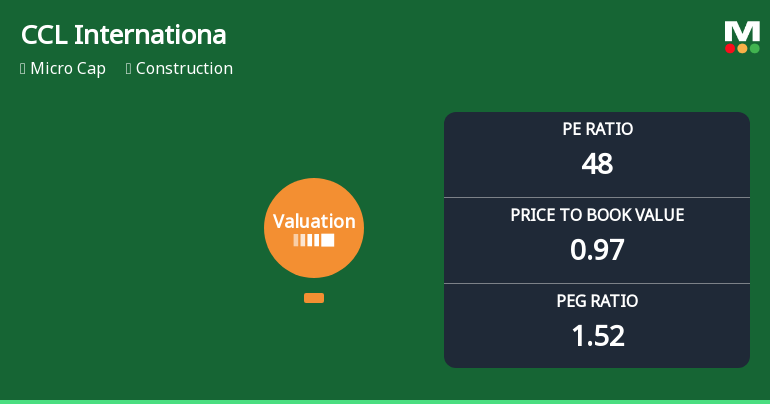
CCL International Ltd has seen a marked deterioration in its valuation attractiveness, with key metrics such as the price-to-earnings (P/E) ratio and price-to-book value (P/BV) signalling increased risk for investors. The company’s recent downgrade to a Strong Sell rating reflects growing concerns over its stretched valuation relative to peers and historical benchmarks within the construction sector.
Read full news article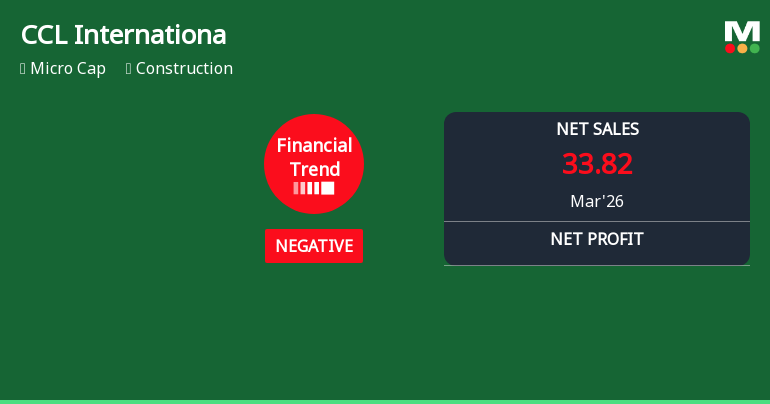
CCL International Ltd Reports Sharp Decline in Quarterly Financial Performance Amid Market Downturn
CCL International Ltd, a micro-cap player in the construction sector, has witnessed a marked deterioration in its financial performance for the quarter ended March 2026, reversing a previously positive trend. The company’s profitability metrics have contracted sharply, reflecting operational challenges and a shift in its financial trajectory that investors should carefully consider.
Read full news article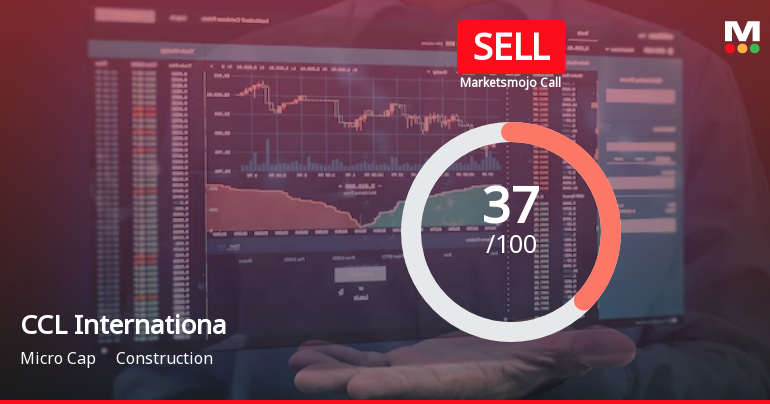
CCL International Ltd is Rated Sell
CCL International Ltd is rated Sell by MarketsMOJO, with this rating last updated on 30 Mar 2026. However, the analysis and financial metrics discussed here reflect the stock’s current position as of 20 May 2026, providing investors with the latest insights into the company’s performance and outlook.
Read full news article Announcements
Announcement under Regulation 30 (LODR)-Newspaper Publication
31-May-2026 | Source : BSENewspaper Publication of Audited Financial Results for the Quarter and Year ended on 31st March 2026.
Disclosure On Related Party Transactions For The Second Half Year As On 31St March 2026
30-May-2026 | Source : BSEDisclosure on Related Party Transactions for the Second Half Year as on 31st March 2026
Compliances-Reg.24(A)-Annual Secretarial Compliance
30-May-2026 | Source : BSEAnnual Secretarial Compliance Certificate for Financial Year ended on 31st March 2026
Corporate Actions

No Upcoming Board Meetings

CCL International Ltd has declared 2% dividend, ex-date: 18 Sep 15

CCL International Ltd has announced 10:2 stock split, ex-date: 04 Dec 15

No Bonus history available

No Rights history available
Quality key factors
Valuation key factors
Technicals key factors
 Technical Indicator Scale: Bearish, Mildly Bearish, Sideways, Mildly Bullish, Bullish Turned
 Shareholding Snapshot : Mar 2026
Shareholding Compare (%holding)
Promoters
1.6319
Held by 0 Schemes
Held by 1 FIIs (0.01%)
Tanvi Fincap Private Limited (16.57%)
Doyen Commercial Private Limited (5.99%)
14.22%
Quarterly Results Snapshot (Standalone) - Mar'26 - YoY

YoY Growth in quarter ended Mar 2026 is -6.08% vs 120.78% in Mar 2025
YoY Growth in quarter ended Mar 2026 is -51.80% vs 221.05% in Mar 2025
Half Yearly Results Snapshot (Standalone) - Sep'25

Growth in half year ended Sep 2025 is 87.38% vs -18.46% in Sep 2024
Growth in half year ended Sep 2025 is 100.00% vs -1,018.18% in Sep 2024
Nine Monthly Results Snapshot (Standalone) - Dec'25
YoY Growth in nine months ended Dec 2025 is 68.60% vs -49.41% in Dec 2024
YoY Growth in nine months ended Dec 2025 is 77.25% vs -548.08% in Dec 2024
Annual Results Snapshot (Standalone) - Mar'26
YoY Growth in year ended Mar 2026 is 9.89% vs 28.35% in Mar 2025
YoY Growth in year ended Mar 2026 is 31.94% vs -51.02% in Mar 2025
About CCL International Ltd

Company Coordinates


