
Compare CCME Global with Similar Stocks
Stock DNA
Pharmaceuticals & Biotechnology
INR 570 Cr (Micro Cap)
NA (Loss Making)
36
0.00%
-0.93
-1.77%
14.23
Total Returns (Price + Dividend) 
CCME Global for the last several years.
Risk Adjusted Returns v/s
Returns Beta

News
Genesis IBRC India Ltd is Rated Sell
Genesis IBRC India Ltd is rated 'Sell' by MarketsMOJO, with this rating last updated on 27 Jan 2026. However, the analysis and financial metrics discussed here reflect the stock's current position as of 31 May 2026, providing investors with an up-to-date view of the company’s fundamentals, valuation, financial trends, and technical outlook.
Read full news article
Genesis IBRC India Ltd is Rated Sell
Genesis IBRC India Ltd is rated 'Sell' by MarketsMOJO, with this rating last updated on 27 Jan 2026. However, all fundamentals, returns, and financial metrics discussed here reflect the stock's current position as of 20 May 2026, providing investors with an up-to-date analysis of the company’s standing.
Read full news article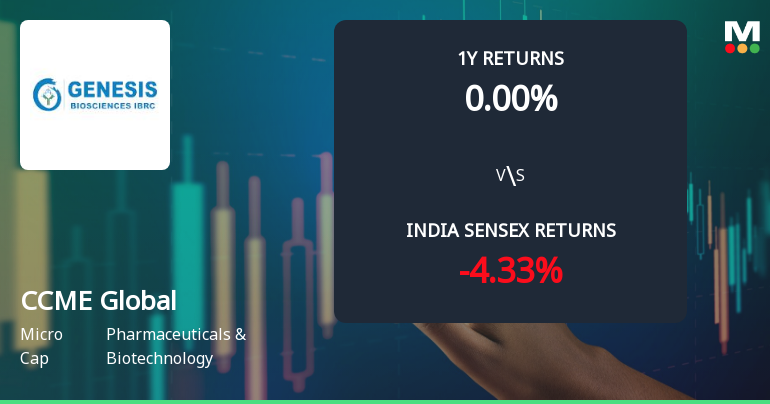
Genesis IBRC India Ltd Sees Bullish Technical Shift Amid Mixed Price Momentum
Genesis IBRC India Ltd, a micro-cap player in the Pharmaceuticals & Biotechnology sector, has recently exhibited a notable shift in its technical momentum, moving from a mildly bullish stance to a more confident bullish trend. Despite a 5.00% decline in the latest trading session, the stock’s technical indicators such as MACD, moving averages, and Bollinger Bands suggest an improving outlook, contrasting with its current Mojo Grade of Sell.
Read full news article Announcements
Closure of Trading Window
25-Jun-2026 | Source : BSEClosure of trading window for the purpose of unaudited financial results for the first quarter of FY 2026 - 2027 ending on June 30 2026.
Announcement under Regulation 30 (LODR)-Resignation of Statutory Auditors
23-Jun-2026 | Source : BSEIntimation for resignation of statutory auditors of the Company.
Announcement under Regulation 30 (LODR)-Change in Management
23-Jun-2026 | Source : BSEIntimation for resignation of statutory auditors of the Company.
Corporate Actions

No Upcoming Board Meetings

No Dividend history available

No Splits history available

No Bonus history available

No Rights history available
Quality key factors
Valuation key factors
Technicals key factors
 Technical Indicator Scale: Bearish, Mildly Bearish, Sideways, Mildly Bullish, Bullish Turned
 Shareholding Snapshot : Mar 2026
Shareholding Compare (%holding)
Promoters
None
Held by 0 Schemes
Held by 0 FIIs
Padmanaban Krishnamoorthy (62.03%)
Vidhu Mohan Pillai (4.42%)
25.07%
Quarterly Results Snapshot (Standalone) - Mar'26 - QoQ
QoQ Growth in quarter ended Mar 2026 is 0.00% vs 0.00% in Dec 2025

QoQ Growth in quarter ended Mar 2026 is -1,566.67% vs 50.00% in Dec 2025
Half Yearly Results Snapshot (Standalone) - Sep'25
Growth in half year ended Sep 2025 is -100.00% vs 0.00% in Sep 2024
Growth in half year ended Sep 2025 is -105.07% vs 4,537.50% in Sep 2024
Nine Monthly Results Snapshot (Standalone) - Dec'25
YoY Growth in nine months ended Dec 2025 is -100.00% vs 0.00% in Dec 2024
YoY Growth in nine months ended Dec 2025 is -105.97% vs 3,620.00% in Dec 2024
Annual Results Snapshot (Standalone) - Mar'26
YoY Growth in year ended Mar 2026 is -98.91% vs 0.00% in Mar 2025
YoY Growth in year ended Mar 2026 is -120.29% vs 192.11% in Mar 2025
About CCME Global Ltd

Company Coordinates


