
Compare C.E. Info System with Similar Stocks
Dashboard
Poor long term growth as Operating profit has grown by an annual rate 17.29% of over the last 5 years
Flat results in Mar 26
With ROE of 14.8, it has a Very Expensive valuation with a 7.2 Price to Book Value
Falling Participation by Institutional Investors
Underperformed the market in the last 1 year
Stock DNA
Software Products
INR 6,407 Cr (Small Cap)
48.00
21
0.00%
-0.36
14.83%
7.04
Total Returns (Price + Dividend) 
Latest dividend: 3.5 per share ex-dividend date: Jul-18-2025
Risk Adjusted Returns v/s
Returns Beta

News
When is the next results date for C.E. Info Systems Ltd?
The next results date for C.E. Info Systems Ltd is scheduled for August 4, 2026....
Read full news article
C.E. Info Systems Ltd is Rated Sell
C.E. Info Systems Ltd is rated 'Sell' by MarketsMOJO, with this rating last updated on 27 Apr 2026. However, the analysis and financial metrics discussed below reflect the stock's current position as of 25 July 2026, providing investors with an up-to-date view of the company’s fundamentals, returns, and market performance.
Read full news article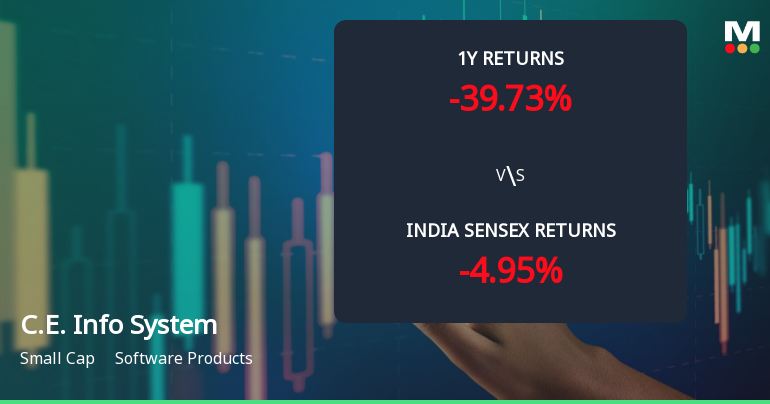
C.E. Info Systems Ltd Technical Momentum Shifts Amid Bearish Sentiment
C.E. Info Systems Ltd, a small-cap player in the Software Products sector, has experienced a notable shift in price momentum and technical indicators, reflecting a complex market sentiment. Despite a recent downgrade in its Mojo Grade from Strong Sell to Sell, the stock exhibits a blend of mildly bullish and bearish signals across weekly and monthly charts, underscoring the need for cautious investor appraisal.
Read full news article Announcements
Board Meeting Intimation for Intimation Of Board Meeting
28-Jul-2026 | Source : BSEC.E. Info Systems Ltdhas informed BSE that the meeting of the Board of Directors of the Company is scheduled on 04/08/2026 inter alia to consider and approve Intimation of Board Meeting
Announcement under Regulation 30 (LODR)-Newspaper Publication
19-Jul-2026 | Source : BSESubmission of Newspaper cuttings regarding 31st AGM of the Company
Notice Of 31St AGM Of The Company
18-Jul-2026 | Source : BSESubmission of Notice of 31st AGM of the Company
Corporate Actions

04 Aug 2026

C.E. Info Systems Ltd has declared 175% dividend, ex-date: 04 Aug 26

No Splits history available

No Bonus history available

No Rights history available
Quality key factors
Valuation key factors
Technicals key factors
 Technical Indicator Scale: Bearish, Mildly Bearish, Sideways, Mildly Bullish, Bullish Turned
 Shareholding Snapshot : Jun 2026
Shareholding Compare (%holding)
Promoters
None
Held by 19 Schemes (11.71%)
Held by 40 FIIs (1.52%)
Rakesh Kumar Verma (41.39%)
Phonepe Limited (13.65%)
15.1%
Quarterly Results Snapshot (Consolidated) - Mar'26 - QoQ

QoQ Growth in quarter ended Mar 2026 is 54.82% vs -17.66% in Dec 2025
QoQ Growth in quarter ended Mar 2026 is 170.48% vs 1.40% in Dec 2025
Half Yearly Results Snapshot (Consolidated) - Sep'25
Growth in half year ended Sep 2025 is 14.73% vs 13.67% in Sep 2024

Growth in half year ended Sep 2025 is -2.34% vs 1.39% in Sep 2024
Nine Monthly Results Snapshot (Consolidated) - Dec'25
YoY Growth in nine months ended Dec 2025 is 2.93% vs 17.32% in Dec 2024
YoY Growth in nine months ended Dec 2025 is -15.43% vs 2.71% in Dec 2024
Annual Results Snapshot (Consolidated) - Mar'26
YoY Growth in year ended Mar 2026 is 2.34% vs 22.09% in Mar 2025
YoY Growth in year ended Mar 2026 is -8.85% vs 9.88% in Mar 2025
About C.E. Info Systems Ltd

Company Coordinates


