
Compare Cella Space with Similar Stocks
Dashboard
Weak Long Term Fundamental Strength with an average Return on Capital Employed (ROCE) of 7.86%
- Company's ability to service its debt is weak with a poor EBIT to Interest (avg) ratio of 1.36
With a growth in Net Sales of 4325%, the company declared Very Positive results in Mar 26
With ROCE of 7.9, it has a Very Expensive valuation with a 1.2 Enterprise value to Capital Employed
Majority shareholders : Promoters
Consistent Returns over the last 3 years
Stock DNA
Paper, Forest & Jute Products
INR 41 Cr (Micro Cap)
10.00
17
0.00%
0.14
12.34%
1.17
Total Returns (Price + Dividend) 
Latest dividend: 0.6000 per share ex-dividend date: Sep-19-2014
Risk Adjusted Returns v/s
Returns Beta

News
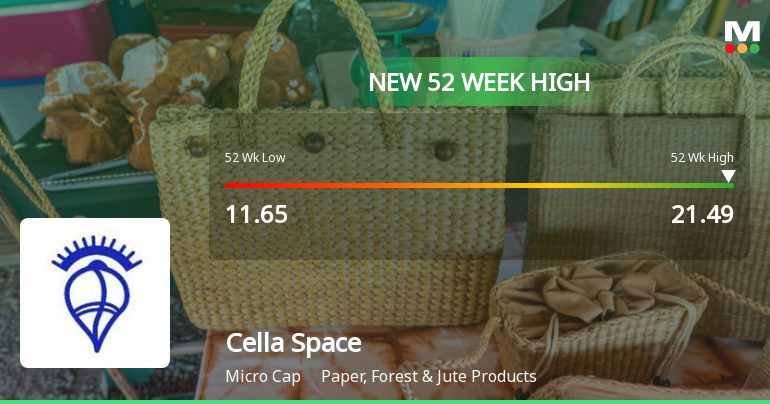
Broad-Based Technical Strength Lifts Cella Space Ltd. to 52-Week High of Rs 21.49
With a decisive break above Rs 21.49 on 19 Jun 2026, Cella Space Ltd. has reached a fresh 52-week high, marking a 41.5% gain over the past year and significantly outperforming the Sensex, which declined by 5.79% during the same period. This milestone reflects a strong technical momentum that has propelled the stock well above its key moving averages and signals robust price action in the Paper, Forest & Jute Products sector.
Read full news article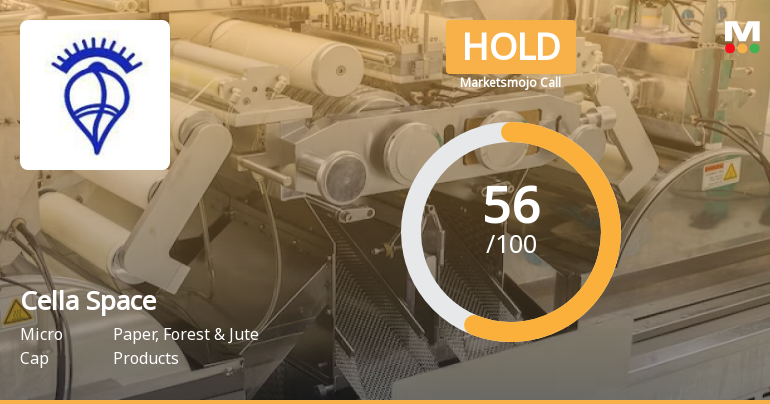
Cella Space Ltd. is Rated Hold by MarketsMOJO
Cella Space Ltd. is rated 'Hold' by MarketsMOJO, with this rating last updated on 29 May 2026. However, the analysis and financial metrics presented here reflect the stock's current position as of 18 June 2026, providing investors with an up-to-date view of the company’s fundamentals, valuation, financial trends, and technical outlook.
Read full news article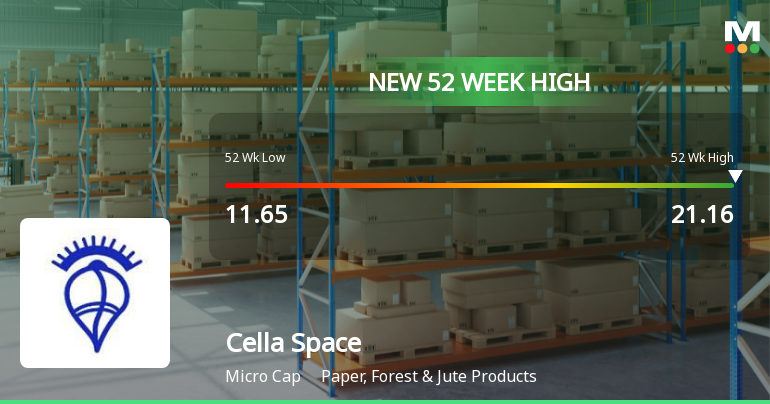
Broad-Based Technical Strength Lifts Cella Space Ltd. to 52-Week High of Rs 21.16
With a sustained rally over eight consecutive sessions delivering a 40.88% gain, Cella Space Ltd. surged to a fresh 52-week high of Rs 21.16 on 17 Jun 2026, outpacing its sector and the broader market by a wide margin.
Read full news article Announcements
Compliances-Reg.24(A)-Annual Secretarial Compliance
29-May-2026 | Source : BSEAnnual Secretarial Compliance Report for the Financial year ended on March 31 2026 as per Regulation 24A of SEBI(LODR) 2015
Board Meeting Outcome for Board Meeting Outcome Of Board Meeting Held On May 26 2026.
26-May-2026 | Source : BSEThe Board Considered and approved 1. Audited Standalone and Consolidated financial results for the quarter and year ended March 31 2026 and Audit report issued by the Statutory auditors of the Company based on the recommendation of Audit Committee; 2. Appointment of Mr. Adith. K. L (ICSI Membership No. - A74922) as Company Secretary and Compliance Officer with effect from 26.05.2026
Board Meeting Intimation for Board Meeting Under Regulation 29 Of SEBI (Listing Obligations And Disclosure Requirements) Regulations 2015.
18-May-2026 | Source : BSECella Space Ltdhas informed BSE that the meeting of the Board of Directors of the Company is scheduled on 26/05/2026 inter alia to consider and approve 1. Audited Standalone and Consolidated financial results for the quarter and year ended March 31 2026 and Audit report issued by the Statutory auditors of the Company based on the recommendation of Audit Committee; 2. Appointment of Mr. Adith. K. L (ICSI Membership No. - A74922) as Company Secretary and Compliance Officer with effect from 26.05.2026
Corporate Actions

No Upcoming Board Meetings

Cella Space Ltd. has declared 6% dividend, ex-date: 19 Sep 14

No Splits history available

No Bonus history available

No Rights history available
Quality key factors
Valuation key factors
Technicals key factors
 Technical Indicator Scale: Bearish, Mildly Bearish, Sideways, Mildly Bullish, Bullish Turned
 Shareholding Snapshot : Mar 2026
Shareholding Compare (%holding)
Promoters
None
Held by 0 Schemes
Held by 0 FIIs
S Rajkumar (51.91%)
None
34.95%
Quarterly Results Snapshot (Standalone) - Mar'26 - QoQ

QoQ Growth in quarter ended Mar 2026 is 4,325.00% vs -45.45% in Dec 2025
QoQ Growth in quarter ended Mar 2026 is 883.72% vs -210.26% in Dec 2025
Half Yearly Results Snapshot (Standalone) - Sep'25
Growth in half year ended Sep 2025 is -6.42% vs -41.71% in Sep 2024

Growth in half year ended Sep 2025 is -96.56% vs 11,954.76% in Sep 2024
Nine Monthly Results Snapshot (Standalone) - Dec'25
YoY Growth in nine months ended Dec 2025 is -8.09% vs -58.48% in Dec 2024
YoY Growth in nine months ended Dec 2025 is -97.42% vs 8,103.23% in Dec 2024
Annual Results Snapshot (Consolidated) - Mar'26
YoY Growth in year ended Mar 2026 is 203.25% vs -66.80% in Mar 2025
YoY Growth in year ended Mar 2026 is -91.17% vs 4,448.67% in Mar 2025
About Cella Space Ltd.

Company Coordinates


