
Compare Cello World with Similar Stocks
Dashboard
Poor long term growth as Operating profit has grown by an annual rate -6.28% of over the last 5 years
Flat results in Mar 26
With ROE of 11.8, it has a Expensive valuation with a 3.1 Price to Book Value
Falling Participation by Institutional Investors
Below par performance in long term as well as near term
Stock DNA
Electronics & Appliances
INR 8,257 Cr (Small Cap)
26.00
45
0.00%
-0.25
11.77%
3.04
Total Returns (Price + Dividend) 
Latest dividend: 1.5 per share ex-dividend date: Aug-02-2024
Risk Adjusted Returns v/s
Returns Beta

News

Cello World Ltd is Rated Sell
Cello World Ltd is rated 'Sell' by MarketsMOJO, with this rating last updated on 27 April 2026. However, the analysis and financial metrics discussed here reflect the stock's current position as of 11 June 2026, providing investors with the most up-to-date view of the company’s fundamentals, returns, and market performance.
Read full news article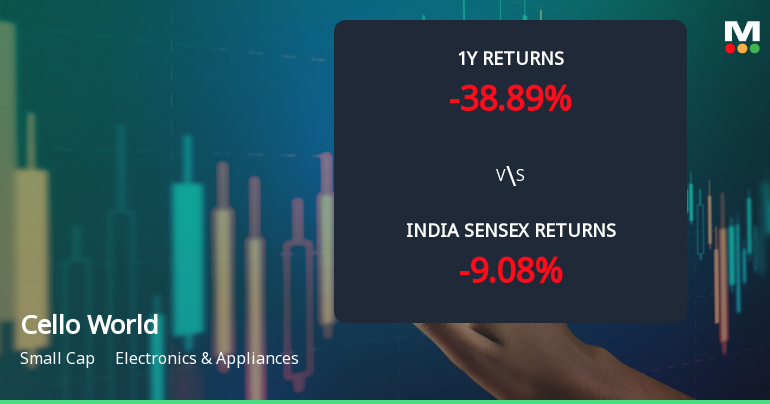
Cello World Ltd Technical Momentum Shifts Amid Mixed Market Signals
Cello World Ltd, a small-cap player in the Electronics & Appliances sector, has exhibited a subtle shift in its technical momentum, moving from a strongly bearish stance to a mildly bearish outlook. Despite a recent uptick in price and some positive signals from weekly MACD, the stock continues to face significant headwinds amid a prolonged downtrend and underperformance relative to the broader market.
Read full news article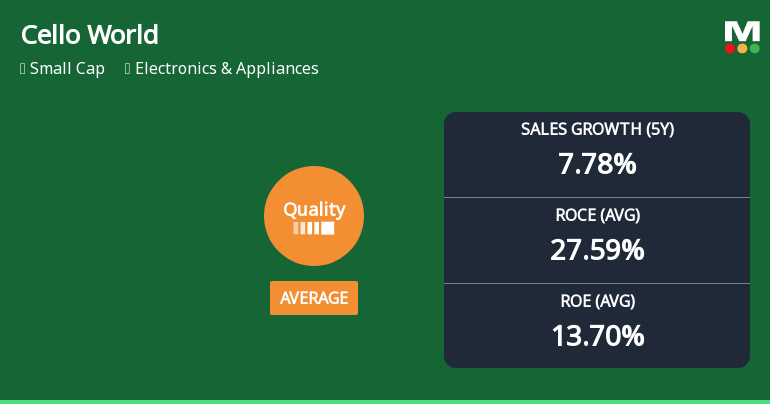
Cello World Ltd Quality Grade Downgrade Highlights Fundamental Challenges
Cello World Ltd, a player in the Electronics & Appliances sector, has recently seen its quality grade downgraded from good to average, reflecting shifts in its core business fundamentals. This article delves into the key financial metrics, including return on equity (ROE), return on capital employed (ROCE), debt levels, and growth consistency, to understand the factors behind this change and its implications for investors.
Read full news article Announcements
Record Date For Final Dividend For The FY 2025-2026
04-Jun-2026 | Source : BSERecord date for final dividend for the FY 2025-2026
Announcement under Regulation 30 (LODR)-Earnings Call Transcript
04-Jun-2026 | Source : BSETranscript for earnings call held on May 29 2026
Announcement under Regulation 30 (LODR)-Analyst / Investor Meet - Outcome
29-May-2026 | Source : BSEInvestor Call audio recording link
Corporate Actions

No Upcoming Board Meetings

Cello World Ltd has declared 30% dividend, ex-date: 31 Jul 26

No Splits history available

No Bonus history available

No Rights history available
Quality key factors
Valuation key factors
Technicals key factors
 Technical Indicator Scale: Bearish, Mildly Bearish, Sideways, Mildly Bullish, Bullish Turned
 Shareholding Snapshot : Mar 2026
Shareholding Compare (%holding)
Promoters
None
Held by 11 Schemes (3.82%)
Held by 95 FIIs (5.52%)
Gaurav Pradeep Rathod (21.48%)
India Advantage Fund S5 I (3.94%)
4.78%
Quarterly Results Snapshot (Consolidated) - Mar'26 - QoQ

QoQ Growth in quarter ended Mar 2026 is 18.05% vs -5.75% in Dec 2025
QoQ Growth in quarter ended Mar 2026 is 41.61% vs -25.71% in Dec 2025
Half Yearly Results Snapshot (Consolidated) - Sep'25
Growth in half year ended Sep 2025 is 12.69% vs 3.12% in Sep 2024

Growth in half year ended Sep 2025 is -3.38% vs 4.33% in Sep 2024
Nine Monthly Results Snapshot (Consolidated) - Dec'25
YoY Growth in nine months ended Dec 2025 is 7.92% vs 4.02% in Dec 2024
YoY Growth in nine months ended Dec 2025 is -11.30% vs 3.44% in Dec 2024
Annual Results Snapshot (Consolidated) - Mar'26
YoY Growth in year ended Mar 2026 is 8.77% vs 6.81% in Mar 2025
YoY Growth in year ended Mar 2026 is -2.16% vs 2.34% in Mar 2025
About Cello World Ltd

Company Coordinates


