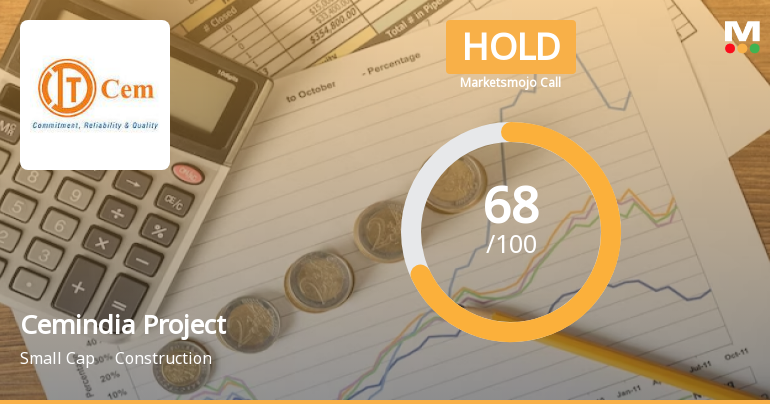
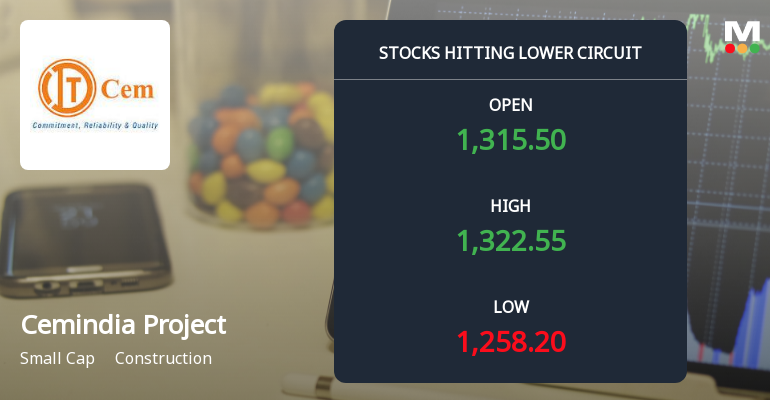
Cemindia Project

  • Market Cap: Small Cap
  • Industry: Construction
  • ISIN: INE686A01026
  • NSEID: CEMPRO
  • BSEID: 509496
INR
1,605.35
-1.55 (-0.1%)
BSENSE

Jul 17, 03:30 PM

BSE+NSE Vol: 7.28 lacs

  • Price Points
  • Score
  • Mojo Parameters
  • Total Return
  • News and Corporate Actions
  • Key factors
  • Shareholding
  • Financials
  • CompanyCV
stock-recommendationUpcoming Result: Cemindia Project will declare its result soon on 28 Jul 2026
stock-summaryPrice Point
High/Low

1Day

52 Week

Valuation
Technical
Day's Volume

CASH

7.28 lacs (16.09%) Volume

Shareholding (Jun 2026)

FII

7.27%

Held by 148 FIIs

DII

2.86%

Held by 7 DIIs

Promoter

67.46%

Why is Cemindia Projects Ltd falling/rising?

18-Jul-2026

As of 17-Jul, Cemindia Projects Ltd's stock price is slightly declining at 1,605.35, following a trend reversal after six days of gains. Despite this, the stock has shown strong overall performance with significant year-to-date growth and remains close to its 52-week high, although reduced investor participation is a concern.

As of 17-Jul, Cemindia Projects Ltd is experiencing a slight decline in its stock price, currently at 1,605.35, which reflects a change of -1.55 (-0.1%). This decrease follows a trend reversal after six consecutive days of gains, indicating a potential correction in the stock's performance. <BR><BR>Despite this recent drop, the stock has shown strong overall performance in various time frames, with a 1-week increase of 2.55%, a 1-month rise of 35.61%, and an impressive year-to-date growth of 103.67%. Additionally, the stock has significantly outperformed the Sensex, which has seen a decline of 8.30% year-to-date. <BR><BR>However, there are some concerning indicators contributing to the current decline. The stock touched an intraday low of Rs 1568.05, representing a 2.42% decrease during the day. Furthermore, there has been a notable drop in investor participation, with delivery volume falling by 56.53% against the 5-day average, suggesting reduced trading activity and interest among investors.<BR><BR>On a positive note, Cemindia Projects Ltd maintains a strong financial position, with high management efficiency and a low debt-to-equity ratio, alongside impressive growth in net sales and profits. Institutional investors have also increased their stake in the company, indicating confidence in its fundamentals. Despite the current decline, the stock remains close to its 52-week high, just 2.66% away, and continues to trade above its moving averages, which may support a rebound in the future.

View full answer

How big is Cemindia Project?

11-Jun-2026

As of 10th June, Cemindia Projects Ltd has a market capitalization of 21,505.00 Cr, with recent net sales of 10,026.54 Cr and a net profit of 597.97 Cr over the last four quarters.

As of 10th June, <BR><BR>Market Cap: Cemindia Projects Ltd has a market capitalization of 21,505.00 Cr, categorizing it as a Small Cap company.<BR><BR>Recent Quarterly Performance: The sum of Net Sales for the latest 4 quarters is 10,026.54 Cr, while the sum of Net Profit for the same period is 597.97 Cr.<BR><BR>Balance Sheet Snapshot: The reporting period is March 2026, with Shareholder's Funds amounting to 2,399.59 Cr and Total Assets totaling 7,035.11 Cr.

View full answer

Who are in the management team of Cemindia Project?

11-Jun-2026

The management team of the Cemindia Project includes Piyachai Karnasuta (Chairman), Santi Jongkongka (Vice Chairman), Jayanta Basu (Managing Director), and three Independent Non-Executive Directors: Sunil Shah Singh, Pankaj I C Jain, and Jana Chatra, along with Rahul Neogi as Company Secretary.

The management team of Cemindia Project includes the following members:<BR><BR>1. **Piyachai Karnasuta** - Chairman (Non-Executive) & Director (Non-Independent)<BR>2. **Santi Jongkongka** - Vice Chairman & Executive Director<BR>3. **Jayanta Basu** - Executive Director & Managing Director<BR>4. **Sunil Shah Singh** - Independent Non-Executive Director<BR>5. **Pankaj I C Jain** - Independent Non-Executive Director<BR>6. **Jana Chatra** - Independent Non-Executive Director<BR>7. **Rahul Neogi** - Company Secretary & Compliance Officer<BR><BR>If you need more information about any specific member or their roles, feel free to ask!

View full answer

Who are the peers of the Cemindia Project?

11-Jun-2026

Peers of the Cemindia Project include NBCC, IRB Infra.Devl., Kalpataru Proj., IndiGrid Trust, KEC International, Engineers India, IRB Infra. Trust, Vertis Infra., and National High. The Cemindia Project shows excellent growth and management risk, with a 1-year return of 51.23%, outperforming some peers with negative returns.

Peers: The peers of the Cemindia Project are NBCC, IRB Infra.Devl., Kalpataru Proj., IndiGrid Trust, KEC Internationa, Engineers India, IRB Infra. Trust, Vertis Infra., and National High.<BR><BR>Quality Snapshot: Excellent management risk is observed at NBCC, while Good management risk is found at Kalpataru Proj., KEC Internationa, Engineers India, and Cemindia Project, and the rest have Average or Below Average management risk. Growth is Excellent at Cemindia Project and IRB Infra. Trust, Good at NBCC and IndiGrid Trust, Average at Kalpataru Proj. and KEC Internationa, and Below Average at IRB Infra.Devl. and Engineers India, while the rest have Below Average growth. Excellent capital structure is noted at NBCC and IndiGrid Trust, Good at Cemindia Project, Average at Kalpataru Proj. and Engineers India, and Below Average at IRB Infra.Devl., KEC Internationa, IRB Infra. Trust, Vertis Infra., and National High.<BR><BR>Return Snapshot: The Cemindia Project has a 1-year return of 51.23%, which is higher than the lowest return of -46.70% from KEC Internationa and lower than the highest return of 19.85% from National High. Additionally, KEC Internationa, IRB Infra.Devl., and Engineers India all have negative six-month returns.

View full answer

What does Cemindia Project do?

10-Jun-2026

Cemindia Projects Ltd, a small-cap construction company established in 1978, reported net sales of ₹2,973 Cr and a net profit of ₹242 Cr for March 2026. It operates under the name ITD Cementation India Limited and has a market cap of ₹21,505 Cr.

Overview: <BR>Cemindia Projects Ltd operates in the construction industry and is categorized as a small-cap company.<BR><BR>History: <BR>The company was incorporated in 1978 as 'Cemindia Company Limited' and has undergone several name changes, becoming ITD Cementation India Limited in 2005. The most recent quarterly results reported net sales and net profit for March 2026.<BR><BR>Financial Snapshot: <BR>Net Sales: 2,973 Cr (Quarterly Results - Mar 2026) <BR>Net Profit: 242 Cr (Quarterly Results - Mar 2026) <BR>Market Cap: INR 21,505 Cr (Small Cap)<BR><BR>Key Metrics: <BR>P/E: 36.00 <BR>Industry P/E: 44 <BR>Dividend Yield: 0.17% <BR>Debt Equity: -0.02 <BR>Return on Equity: 24.92% <BR>Price to Book: 8.62<BR><BR>Contact Details: <BR>Address: National Plastic Building, A-Subhash Road Vile Parle (E) Mumbai Maharashtra : 400057 <BR>Tel: 91-22-67680600/66931600 <BR>Email: investors.relation@itdcem.co.in <BR>Website: http://www.itdcem.co.in

View full answer

Should I buy, sell or hold Cemindia Projects Ltd?

03-Jun-2026

Are Cemindia Projects Ltd latest results good or bad?

30-Apr-2026

Cemindia Projects Ltd, now ITD Cementation, reported strong Q4 FY26 results with net sales of ₹2,973.49 crores, a 17.42% year-on-year increase, and a net profit of ₹242.17 crores, up 113.63% from last year. Overall, the results are very positive, indicating strong performance and improved efficiency.

Cemindia Projects Ltd, now known as ITD Cementation, has reported impressive results for Q4 FY26, indicating strong performance. The company achieved net sales of ₹2,973.49 crores, reflecting a significant 17.42% increase year-on-year and a remarkable 28.42% growth compared to the previous quarter. This marks the highest quarterly revenue in its recent history.<BR><BR>The net profit for the quarter was ₹242.17 crores, which is an extraordinary 113.63% increase from the same quarter last year. Additionally, the operating margin reached 12.03%, the highest in eight quarters, showcasing improved efficiency and profitability. The return on equity (ROE) also stands strong at 21.77%, indicating effective capital utilization.<BR><BR>Overall, the results are quite positive, highlighting strong execution across its project portfolio and positioning the company well within the infrastructure construction sector in India. The significant growth in both revenue and profit, along with improved margins, suggests that ITD Cementation is performing exceptionally well.

View full answer

Is Cemindia Project technically bullish or bearish?

03-Dec-2025

As of December 2, 2025, the trend has shifted to bullish with moderate strength, supported by positive daily moving averages and strong OBV performance, although caution is advised due to mildly bearish weekly MACD and KST indicators.

As of 2 December 2025, the technical trend has changed from mildly bullish to bullish. The current stance is bullish with moderate strength. Key indicators driving this include the bullish signals from the daily moving averages and the monthly Bollinger Bands, alongside a strong performance in the OBV on both weekly and monthly time frames. However, the weekly MACD and KST are mildly bearish, indicating some caution. Overall, the bullish trend is supported by strong returns compared to the Sensex across multiple time frames, particularly the 3-year and 5-year periods.

View full answer

Is Cemindia Project overvalued or undervalued?

28-Nov-2025

As of November 27, 2025, Cemindia Project is considered overvalued with a valuation grade shift from attractive to expensive, reflected in its PE Ratio of 31.28, EV to EBITDA of 15.71, and ROE of 21.77%, despite outperforming the Sensex with a 59.57% return over the past year.

As of 27 November 2025, the valuation grade for Cemindia Project has moved from attractive to expensive, indicating a shift in perception regarding its market value. The company is currently considered overvalued. Key ratios include a PE Ratio of 31.28, an EV to EBITDA of 15.71, and a ROE of 21.77%. <BR><BR>In comparison to its peers, Cemindia's PE Ratio is lower than that of Larsen & Toubro, which stands at 35.01, but higher than IRB Infrastructure Development's PE of 29.81. While Cemindia has shown impressive returns, outperforming the Sensex significantly over the past year with a return of 59.57% compared to the Sensex's 6.84%, the current valuation metrics suggest that the stock may not justify its price at this level.

View full answer

How has been the historical performance of Cemindia Project?

30-Oct-2025

Cemindia Project has shown consistent growth, with net sales increasing from 2,727.73 Cr in Mar'21 to 9,096.94 Cr in Mar'25, and profit after tax rising from 15.92 Cr to 374.09 Cr in the same period. Key financial metrics indicate robust growth and improved profitability over the years.

Answer:<BR>The historical performance of Cemindia Project shows a consistent growth trajectory in net sales and profitability over the years.<BR><BR>Breakdown:<BR>Cemindia Project has demonstrated significant growth in net sales, increasing from 2,727.73 Cr in Mar'21 to 9,096.94 Cr in Mar'25. This upward trend is reflected in total operating income, which also rose from 2,860.71 Cr in Mar'20 to 9,096.94 Cr in Mar'25. The company's operating profit (PBDIT) has improved notably, reaching 924.20 Cr in Mar'25, up from 300.16 Cr in Mar'20. Profit before tax has followed a similar pattern, climbing from 32.25 Cr in Mar'20 to 503.60 Cr in Mar'25, while profit after tax increased from 15.92 Cr in Mar'20 to 374.09 Cr in Mar'25. The earnings per share (EPS) also saw a substantial rise, from 2.51 in Mar'20 to 21.7 in Mar'25. On the balance sheet, total assets grew from 3,122.75 Cr in Mar'20 to 6,459.08 Cr in Mar'25, with total liabilities increasing from 3,122.75 Cr to 6,459.08 Cr over the same period. Cash flow from operating activities peaked at 202.00 Cr in Mar'25, although the net cash outflow was -251.00 Cr. Overall, Cemindia Project's financial metrics indicate a robust growth trajectory and improved profitability over the years.

View full answer

When is the next results date for ITD Cem?

23-Jul-2025

The next results date for ITD Cem is 30 July 2025.

The next results date for ITD Cem is scheduled for 30 July 2025.

View full answer

Who are the top shareholders of the ITD Cem?

17-Jul-2025

The top shareholders of ITD Cem include Italian Thai Development Public Company Limited with 46.64%, followed by 145 Foreign Institutional Investors holding 13.95%, and individual investors with 23.27%. Notably, the Massachusetts Institute of Technology is the highest public shareholder at 2.95%.

The top shareholders of ITD Cem include the following key stakeholders:<BR><BR>1. **Promoter with the highest holding**: Italian Thai Development Public Company Limited, which holds 46.64% of the shares.<BR>2. **Mutual Funds**: Eight schemes collectively hold 2.93%.<BR>3. **Foreign Institutional Investors (FIIs)**: A total of 145 FIIs hold 13.95% of the shares.<BR>4. **Highest Public Shareholder**: Massachusetts Institute of Technology, with a holding of 2.95%.<BR>5. **Individual Investors**: They collectively hold 23.27% of the shares.<BR><BR>Overall, the majority of the shares are held by promoters, with no pledged promoter holdings reported.

View full answer

Has ITD Cem declared dividend?

06-Jun-2025

Yes, ITD Cementation India Ltd has declared a 170% dividend, amounting to ₹1.7 per share, with an ex-date of August 21, 2024. The company has shown significant price appreciation over the years, with total returns reaching up to 1742.5% over the past five years.

ITD Cementation India Ltd has declared a 170% dividend.<BR><BR>Dividend Details:<BR>- Percentage announced: 170%<BR>- Amount per share: 1.7<BR>- Ex-date: 21 Aug 24<BR><BR>Dividend Yield: 0.22%.<BR><BR>Total Returns by Period:<BR>In the last 6 months, the price return was 47.92%, the dividend return was 0%, resulting in a total return of 47.92%.<BR><BR>Over the past year, the price return was 77.47%, with a dividend return of 0.38%, leading to a total return of 77.85%.<BR><BR>In the 2-year period, the price return reached 355.61%, the dividend return was 1.47%, culminating in a total return of 357.08%.<BR><BR>For the 3-year period, the price return was an impressive 1122.24%, while the dividend return was 4.57%, resulting in a total return of 1126.81%.<BR><BR>In the last 4 years, the price return stood at 824.37%, with a dividend return of 3.65%, giving a total return of 828.02%.<BR><BR>Finally, over the past 5 years, the price return was 1736.34%, and the dividend return was 6.16%, leading to a total return of 1742.5%.<BR><BR>Overall, ITD Cementation India Ltd has shown substantial price appreciation over the years, alongside a recently declared dividend, indicating a positive return for investors. The dividend yield remains modest, reflecting a focus on capital gains.

View full answer
iScoreScore
Part of MojoOne Strategy
Click here to find our call on this stock
Strong Sell
Sell
Hold
Buy
Strong Buy

Dashboard

1

High Management Efficiency with a high ROCE of 28.97%

 
2

Company has a Debt to Equity ratio (avg) of 0.03 times

 
3

Healthy long term growth as Net Sales has grown by an annual rate of 29.74% and Operating profit at 49.65%

 
4

With a growth in Net Profit of 118.39%, the company declared Very Positive results in Mar 26

5

With ROE of 24.9, it has a Fair valuation with a 11.5 Price to Book Value

stock-summaryMojo Parameters

Mojo Parameters

Loading Valuation Snapshot...

Stock DNA

stock-summary
Industry

Construction

stock-summary
Market cap

INR 27,307 Cr (Small Cap)

stock-summary
P/E

46.00

stock-summary
Industry P/E

44

stock-summary
Dividend Yield

0.31%

stock-summary
Debt Equity

-0.02

stock-summary
Return on Equity

24.92%

stock-summary
Price to Book

11.41

Revenue and Profits:
Net Sales:
2,973 Cr
(Quarterly Results - Mar 2026)
Net Profit:
242 Cr
stock-summaryTotal Returns
Total Returns (Price + Dividend) stock-summary
Dividend Yield (0.31%)
TimePeriod
Price Return
Dividend Return
Total Return
3 Months
147.53%
0.47%
148.0%
6 Months
137.32%
0.45%
137.77%
1 Year
95.16%
0.62%
95.78%
2 Years
212.81%
1.31%
214.12%
3 Years
795.84%
4.16%
800.0%
4 Years
2043.32%
9.19%
2052.51%
5 Years
1644.95%
9.36%
1654.31%

Latest dividend: 2.974558303886926 per share ex-dividend date: Jun-12-2026

Risk Adjusted Returns v/s stock-summary
Returns Beta
Icon
Beta has not been calculated since enough price history is not available
stock-summaryNews & Corporate Actions

News

Announcements stock-summary

Announcement under Regulation 30 (LODR)-Analyst / Investor Meet - Intimation

16-Jul-2026 | Source : BSE

Further to our letter dated 7th July 2026 we would like to inform you that pursuant to Regulation 30(6) read with clause 15 (a) of Para A of Part A of Schedule III of the Securities and Exchange Board of India (Listing Obligations and Disclosure Requirements) Regulations 2015 as amended from time to time the Analysts & Institutional Investors Conference Call will be held on Wednesday 29th July 2026 at 12.00 p.m. (IST) relating to the Unaudited Financial Results for the quarter ended 30th June 2026. Copy of the invitation is enclosed. Kindly also note that the date and time indicated above are subject to change which may happen due to exigencies on the part of the investors / Company.

Compliances-Certificate under Reg. 74 (5) of SEBI (DP) Regulations 2018

08-Jul-2026 | Source : BSE

We submit herewith confirmation certificate provided by KFin Technologies Limited Registrar and Share Transfer Agent of the Company pursuant to Regulation 74(5) of Securities and Exchange Board of India (Depositories and Participants) Regulations 2018 in respect of securities dematerialized during the quarter ended 30th June 2026.

Board Meeting Intimation for Intimation Of Board Meeting

07-Jul-2026 | Source : BSE

Cemindia Projects Ltdhas informed BSE that the meeting of the Board of Directors of the Company is scheduled on 28/07/2026 inter alia to consider and approve Pursuant to Regulation 29 and other applicable provisions of the SEBI (Listing Obligations and Disclosure Requirements) Regulations 2015 we would like to inform that a meeting of the Board of Directors of the Company will be held on Tuesday 28thJuly 2026 inter alia to consider and approve the Unaudited (Standalone and Consolidated) Financial Results of the Company for the quarter ended 30th June 2026.

Corporate Actions stock-summary

stock-summary
BOARD MEETING

28 Jul 2026

stock-summary
DIVIDEND

Cemindia Projects Ltd has declared 300% dividend, ex-date: 12 Jun 26

stock-summary
SPLITS

Cemindia Projects Ltd has announced 1:10 stock split, ex-date: 21 Aug 15

stock-summary
BONUS

No Bonus history available

stock-summary
RIGHTS

Cemindia Projects Ltd has announced 1:1 rights issue, ex-date: 30 Oct 07

stock-summaryKey Factors

Quality key factors stock-summary

Factor
Value
Sales Growth (5y)
29.74%
EBIT Growth (5y)
49.65%
EBIT to Interest (avg)
2.48
Debt to EBITDA (avg)
1.23
Net Debt to Equity (avg)
-0.02
Sales to Capital Employed (avg)
3.11
Tax Ratio
26.38%
Dividend Payout Ratio
8.62%
Pledged Shares
0
Institutional Holding
10.13%
ROCE (avg)
30.67%
ROE (avg)
15.94%

Valuation key factors

Factor
Value
P/E Ratio
46
Industry P/E
44
Price to Book Value
11.49
EV to EBIT
32.45
EV to EBITDA
27.15
EV to Capital Employed
11.69
EV to Sales
2.75
PEG Ratio
0.76
Dividend Yield
0.31%
ROCE (Latest)
36.02%
ROE (Latest)
24.92%

Technicals key factors

Indicator
Weekly
Monthly
MACD
Bullish
Bullish
RSI
Bearish
Bearish
Bollinger Bands
Bullish
Bullish
Moving Averages
Bullish (Daily)
KST
Bullish
Mildly Bearish
Dow Theory
Bullish
Bullish
OBV
Bullish
Bullish
stock-summary Technical Indicator Scale: Bearish, Mildly Bearish, Sideways, Mildly Bullish, Bullish  Turned 
stock-summaryShareholding
Shareholding Snapshot : Jun 2026stock-summary
Shareholding Compare (%holding) stock-summary
Majority shareholders

Promoters

Pledged Promoter Holdings

None

Mutual Funds

Held by 25 Schemes (2.31%)

FIIs

Held by 148 FIIs (7.27%)

Promoter with highest holding

Renew Exim Dmcc (67.46%)

Highest Public shareholder

Cd Equifinance Private Limited (1.8%)

Individual Investors Holdings

17.0%

stock-summaryFinancial
[
  {
    "link": "quarterly",
    "btn_text": "All Quarterly Results",
    "header": "Quarterly Results Snapshot (Consolidated) - Mar'26 - QoQ",
    "rhs": [
      {
        "prefix": "Net Sales ",
        "suffix": "QoQ Growth in quarter ended Mar 2026 is 28.42% vs 5.48% in Dec 2025",
        "dir": 1
      },
      {
        "prefix": "Consolidated Net Profit ",
        "suffix": "QoQ Growth in quarter ended Mar 2026 is 118.39% vs 2.97% in Dec 2025",
        "dir": 1
      }
    ],
    "table": {
      "header": [
        "Mar'26",
        "Dec'25",
        "Change(%)"
      ],
      "body": [
        {
          "field": "Net Sales",
          "val1": "2,973.49",
          "val2": "2,315.48",
          "chgp": "28.42%",
          "chgp_class": "positive"
        },
        {
          "field": "Operating Profit (PBDIT) excl Other Income",
          "val1": "357.73",
          "val2": "221.80",
          "chgp": "61.28%",
          "chgp_class": "positive"
        },
        {
          "field": "Interest",
          "val1": "61.08",
          "val2": "50.11",
          "chgp": "21.89%",
          "chgp_class": "negative"
        },
        {
          "field": "Exceptional Items",
          "val1": "0.00",
          "val2": "0.00",
          "chgp": "",
          "chgp_class": "neutral"
        },
        {
          "field": "Consolidate Net Profit",
          "val1": "242.17",
          "val2": "110.89",
          "chgp": "118.39%",
          "chgp_class": "positive"
        },
        {
          "field": "Operating Profit Margin (Excl OI)",
          "val1": "12.03%",
          "val2": "9.58%",
          "chgp": "2.45%",
          "chgp_class": "positive"
        }
      ]
    }
  },
  {
    "link": "half-yearly",
    "btn_text": "All Half Yearly Results",
    "header": "Half Yearly Results Snapshot (Consolidated) - Sep'25",
    "rhs": [
      {
        "prefix": "Net Sales ",
        "suffix": " Growth in half year ended Sep 2025 is 7.90% vs 26.99% in Sep 2024",
        "dir": -1
      },
      {
        "prefix": "Consolidated Net Profit ",
        "suffix": " Growth in half year ended Sep 2025 is 42.18% vs 62.74% in Sep 2024",
        "dir": -1
      }
    ],
    "table": {
      "header": [
        "Sep'25",
        "Sep'24",
        "Change(%)"
      ],
      "body": [
        {
          "field": "Net Sales",
          "val1": "4,717.81",
          "val2": "4,372.36",
          "chgp": "7.90%",
          "chgp_class": "positive"
        },
        {
          "field": "Operating Profit (PBDIT) excl Other Income",
          "val1": "436.16",
          "val2": "403.08",
          "chgp": "8.21%",
          "chgp_class": "positive"
        },
        {
          "field": "Interest",
          "val1": "102.56",
          "val2": "110.09",
          "chgp": "-6.84%",
          "chgp_class": "positive"
        },
        {
          "field": "Exceptional Items",
          "val1": "0.00",
          "val2": "0.00",
          "chgp": "",
          "chgp_class": "neutral"
        },
        {
          "field": "Consolidate Net Profit",
          "val1": "244.88",
          "val2": "172.23",
          "chgp": "42.18%",
          "chgp_class": "positive"
        },
        {
          "field": "Operating Profit Margin (Excl OI)",
          "val1": "9.24%",
          "val2": "9.22%",
          "chgp": "0.02%",
          "chgp_class": "positive"
        }
      ]
    }
  },
  {
    "link": "nine-monthly",
    "btn_text": "All Nine Monthly Results",
    "header": "Nine Monthly Results Snapshot (Consolidated) - Dec'25",
    "rhs": [
      {
        "prefix": "Net Sales ",
        "suffix": "YoY Growth in nine months ended Dec 2025 is 5.88% vs 21.66% in Dec 2024",
        "dir": -1
      },
      {
        "prefix": "Consolidated Net Profit ",
        "suffix": "YoY Growth in nine months ended Dec 2025 is 37.22% vs 40.74% in Dec 2024",
        "dir": -1
      }
    ],
    "table": {
      "header": [
        "Dec'25",
        "Dec'24",
        "Change(%)"
      ],
      "body": [
        {
          "field": "Net Sales",
          "val1": "7,033.29",
          "val2": "6,642.80",
          "chgp": "5.88%",
          "chgp_class": "positive"
        },
        {
          "field": "Operating Profit (PBDIT) excl Other Income",
          "val1": "657.96",
          "val2": "610.23",
          "chgp": "7.82%",
          "chgp_class": "positive"
        },
        {
          "field": "Interest",
          "val1": "152.67",
          "val2": "168.60",
          "chgp": "-9.45%",
          "chgp_class": "positive"
        },
        {
          "field": "Exceptional Items",
          "val1": "0.00",
          "val2": "0.00",
          "chgp": "",
          "chgp_class": "neutral"
        },
        {
          "field": "Consolidate Net Profit",
          "val1": "355.77",
          "val2": "259.27",
          "chgp": "37.22%",
          "chgp_class": "positive"
        },
        {
          "field": "Operating Profit Margin (Excl OI)",
          "val1": "9.35%",
          "val2": "9.19%",
          "chgp": "0.16%",
          "chgp_class": "positive"
        }
      ]
    }
  },
  {
    "link": "annual",
    "btn_text": "All Annual Results",
    "header": "Annual Results Snapshot (Consolidated) - Mar'26",
    "rhs": [
      {
        "prefix": "Net Sales ",
        "suffix": "YoY Growth in year ended Mar 2026 is 8.81% vs 19.80% in Mar 2025",
        "dir": -1
      },
      {
        "prefix": "Consolidated Net Profit ",
        "suffix": "YoY Growth in year ended Mar 2026 is 60.34% vs 36.19% in Mar 2025",
        "dir": 1
      }
    ],
    "table": {
      "header": [
        "Mar'26",
        "Mar'25",
        "Change(%)"
      ],
      "body": [
        {
          "field": "Net Sales",
          "val1": "10,060.58",
          "val2": "9,246.16",
          "chgp": "8.81%",
          "chgp_class": "positive"
        },
        {
          "field": "Operating Profit (PBDIT) excl Other Income",
          "val1": "1,021.56",
          "val2": "861.82",
          "chgp": "18.54%",
          "chgp_class": "positive"
        },
        {
          "field": "Interest",
          "val1": "215.01",
          "val2": "236.28",
          "chgp": "-9.00%",
          "chgp_class": "positive"
        },
        {
          "field": "Exceptional Items",
          "val1": "0.00",
          "val2": "0.00",
          "chgp": "",
          "chgp_class": "neutral"
        },
        {
          "field": "Consolidate Net Profit",
          "val1": "597.73",
          "val2": "372.78",
          "chgp": "60.34%",
          "chgp_class": "positive"
        },
        {
          "field": "Operating Profit Margin (Excl OI)",
          "val1": "10.15%",
          "val2": "9.32%",
          "chgp": "0.83%",
          "chgp_class": "positive"
        }
      ]
    }
  }
]

Quarterly Results Snapshot (Consolidated) - Mar'26 - QoQstock-summary

Mar'26
Dec'25
Change(%)
Net Sales
2,973.49
2,315.48
28.42%
Operating Profit (PBDIT) excl Other Income
357.73
221.80
61.28%
Interest
61.08
50.11
21.89%
Exceptional Items
0.00
0.00
Consolidate Net Profit
242.17
110.89
118.39%
Operating Profit Margin (Excl OI)
12.03%
9.58%
2.45%
Values in Rs Cr.
Direction Arrows
Net Sales

QoQ Growth in quarter ended Mar 2026 is 28.42% vs 5.48% in Dec 2025

Direction Arrows
Consolidated Net Profit

QoQ Growth in quarter ended Mar 2026 is 118.39% vs 2.97% in Dec 2025

Half Yearly Results Snapshot (Consolidated) - Sep'25stock-summary

Sep'25
Sep'24
Change(%)
Net Sales
4,717.81
4,372.36
7.90%
Operating Profit (PBDIT) excl Other Income
436.16
403.08
8.21%
Interest
102.56
110.09
-6.84%
Exceptional Items
0.00
0.00
Consolidate Net Profit
244.88
172.23
42.18%
Operating Profit Margin (Excl OI)
9.24%
9.22%
0.02%
Values in Rs Cr.
Direction Arrows
Net Sales

Growth in half year ended Sep 2025 is 7.90% vs 26.99% in Sep 2024

Direction Arrows
Consolidated Net Profit

Growth in half year ended Sep 2025 is 42.18% vs 62.74% in Sep 2024

Nine Monthly Results Snapshot (Consolidated) - Dec'25stock-summary

Dec'25
Dec'24
Change(%)
Net Sales
7,033.29
6,642.80
5.88%
Operating Profit (PBDIT) excl Other Income
657.96
610.23
7.82%
Interest
152.67
168.60
-9.45%
Exceptional Items
0.00
0.00
Consolidate Net Profit
355.77
259.27
37.22%
Operating Profit Margin (Excl OI)
9.35%
9.19%
0.16%
Values in Rs Cr.
Direction Arrows
Net Sales

YoY Growth in nine months ended Dec 2025 is 5.88% vs 21.66% in Dec 2024

Direction Arrows
Consolidated Net Profit

YoY Growth in nine months ended Dec 2025 is 37.22% vs 40.74% in Dec 2024

Annual Results Snapshot (Consolidated) - Mar'26stock-summary

Mar'26
Mar'25
Change(%)
Net Sales
10,060.58
9,246.16
8.81%
Operating Profit (PBDIT) excl Other Income
1,021.56
861.82
18.54%
Interest
215.01
236.28
-9.00%
Exceptional Items
0.00
0.00
Consolidate Net Profit
597.73
372.78
60.34%
Operating Profit Margin (Excl OI)
10.15%
9.32%
0.83%
Values in Rs Cr.
Direction Arrows
Net Sales

YoY Growth in year ended Mar 2026 is 8.81% vs 19.80% in Mar 2025

Direction Arrows
Consolidated Net Profit

YoY Growth in year ended Mar 2026 is 60.34% vs 36.19% in Mar 2025

stock-summaryCompany CV
About Cemindia Projects Ltd stock-summary
stock-summary
Cemindia Projects Ltd
Small Cap
Construction
ITD Cementation India Limited was incorporated on June 24, 1978 as 'Cemindia Company Limited' and obtained Certificate of Commencement of Business on 6th November, 1978. The Company changed its name from Cemindia Company Limited to Kvaerner Cementation India Limited in 1995 and further to Skanska Cementation India Limited in July, 2001. Subsequently, the name was changed to ITD Cementation India Limited from Skanska Cementation India Limited in June, 2005.
Company Coordinates stock-summary
Company Details
National Plastic Building, A-Subhash Road Vile Parle (E) Mumbai Maharashtra : 400057
stock-summary
Tel: 91-22-67680600/66931600
stock-summary
investors.relation@itdcem.co.in
Registrar Details
Karvy Computershare Pvt Ltd., Karvy Selenium, Tower-B Plot No 31 & 32, Survey No 116/22, 115/24, 115/25, Financial District, Nanakramguda, Serilingampally, Mandal Ranga Reddy Dist, Hyderabad