
Compare Cemindia Project with Similar Stocks
Dashboard
High Management Efficiency with a high ROCE of 28.97%
Company has a Debt to Equity ratio (avg) of 0.03 times
Healthy long term growth as Net Sales has grown by an annual rate of 29.74% and Operating profit at 49.65%
With a growth in Net Profit of 118.39%, the company declared Very Positive results in Mar 26
With ROE of 24.9, it has a Attractive valuation with a 8.8 Price to Book Value
Stock DNA
Construction
INR 21,708 Cr (Small Cap)
35.00
48
0.39%
-0.02
24.92%
9.09
Total Returns (Price + Dividend) 
Latest dividend: 2.974558303886926 per share ex-dividend date: Jun-12-2026
Risk Adjusted Returns v/s
Returns Beta

News
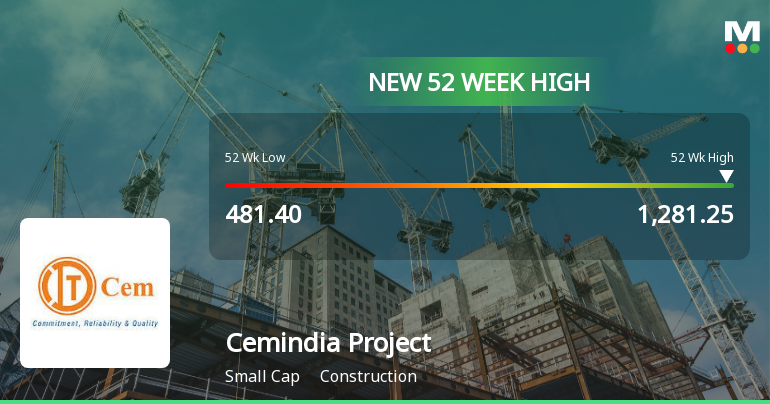
Broad-Based Technical Strength Lifts Cemindia Projects Ltd to 52-Week High of Rs 1281.25
With a remarkable ascent from Rs 481.40 to Rs 1281.25 over the past year, Cemindia Projects Ltd has surged 56.43%, significantly outperforming the Sensex's decline of 5.83%. This milestone was reached on 23 Jun 2026, propelled by a confluence of strong technical signals and sustained price momentum.
Read full news article
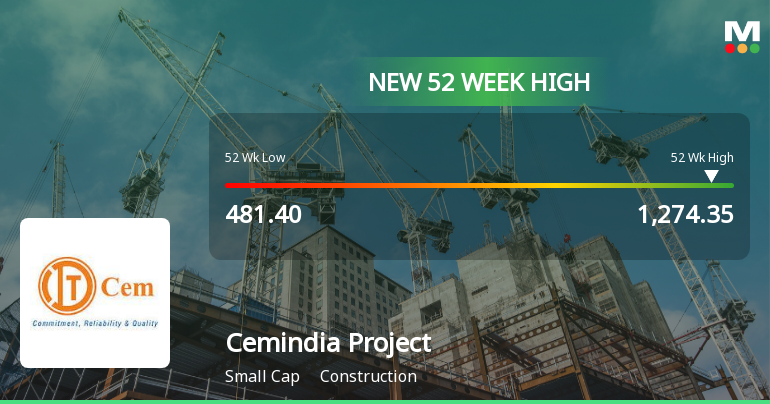
Cemindia Projects Ltd Hits New 52-Week High of Rs 1274.35 on Back of Strong Technical Signals
From a 52-week low of Rs 481.40 to a fresh peak of Rs 1274.35, Cemindia Projects Ltd has surged 56.79% over the past year, significantly outperforming the Sensex which declined by 6.34% in the same period. This milestone reflects a powerful momentum driven by a confluence of technical indicators and sustained price strength.
Read full news article Announcements
ITD Cementation India Limited - Other General Purpose
22-Nov-2019 | Source : NSEITD Cementation India Limited has informed the Exchange regarding Related Party Transaction disclosure under Regulation 23(9) of the SEBI (Listing Obligations and Disclosure Requirements) Regulations, 2015.
ITD Cementation India Limited - Investor Presentation
18-Nov-2019 | Source : NSEITD Cementation India Limited has informed the Exchange regarding Investor Presentation
ITD Cementation India Limited - Updates
15-Nov-2019 | Source : NSEITD Cementation India Limited has informed the Exchange regarding 'Further to our letter dated 5th November, 2019, we send herewith photocopies of paper cuttings from Free Press Journal and Navshakti both dated 6th November, 2019, calling a Board Meeting on Wednesday, 13th November, 2019, to take on record the Unaudited Financial Results for the quarter and six months ended 30th September, 2019.'.
Corporate Actions

No Upcoming Board Meetings

Cemindia Projects Ltd has declared 300% dividend, ex-date: 12 Jun 26

Cemindia Projects Ltd has announced 1:10 stock split, ex-date: 21 Aug 15

No Bonus history available

Cemindia Projects Ltd has announced 1:1 rights issue, ex-date: 30 Oct 07
Quality key factors
Valuation key factors
Technicals key factors
 Technical Indicator Scale: Bearish, Mildly Bearish, Sideways, Mildly Bullish, Bullish Turned
 Shareholding Snapshot : Mar 2026
Shareholding Compare (%holding)
Promoters
None
Held by 18 Schemes (1.41%)
Held by 134 FIIs (7.31%)
Renew Exim Dmcc (67.46%)
Hitesh Ramji Javeri (1.78%)
17.82%
Quarterly Results Snapshot (Consolidated) - Mar'26 - QoQ

QoQ Growth in quarter ended Mar 2026 is 28.42% vs 5.48% in Dec 2025
QoQ Growth in quarter ended Mar 2026 is 118.39% vs 2.97% in Dec 2025
Half Yearly Results Snapshot (Consolidated) - Sep'25

Growth in half year ended Sep 2025 is 7.90% vs 26.99% in Sep 2024
Growth in half year ended Sep 2025 is 42.18% vs 62.74% in Sep 2024
Nine Monthly Results Snapshot (Consolidated) - Dec'25
YoY Growth in nine months ended Dec 2025 is 5.88% vs 21.66% in Dec 2024
YoY Growth in nine months ended Dec 2025 is 37.22% vs 40.74% in Dec 2024
Annual Results Snapshot (Consolidated) - Mar'26
YoY Growth in year ended Mar 2026 is 8.81% vs 19.80% in Mar 2025
YoY Growth in year ended Mar 2026 is 60.34% vs 36.19% in Mar 2025
About Cemindia Projects Ltd

Company Coordinates


