
Compare Cera Sanitary. with Similar Stocks
Dashboard
High Management Efficiency with a high ROE of 17.11%
The company is Net-Debt Free
Poor long term growth as Net Sales has grown by an annual rate of 11.27% and Operating profit at 14.58% over the last 5 years
Flat results in Mar 26
With ROE of 18.3, it has a Attractive valuation with a 5.8 Price to Book Value
High Institutional Holdings at 28.37%
Consistent Underperformance against the benchmark over the last 3 years
Stock DNA
Diversified consumer products
INR 7,709 Cr (Small Cap)
32.00
30
1.11%
-0.47
18.26%
5.58
Total Returns (Price + Dividend) 
Latest dividend: 65 per share ex-dividend date: Jul-01-2025
Risk Adjusted Returns v/s
Returns Beta

News
Cera Sanitaryware Ltd is Rated Hold by MarketsMOJO
Cera Sanitaryware Ltd is rated 'Hold' by MarketsMOJO, with this rating last updated on 08 May 2026. While the rating change occurred on that date, the analysis and financial metrics discussed here reflect the stock's current position as of 13 June 2026, providing investors with an up-to-date view of the company’s fundamentals, returns, and market standing.
Read full news article
Cera Sanitaryware Ltd is Rated Hold by MarketsMOJO
Cera Sanitaryware Ltd is rated 'Hold' by MarketsMOJO, with this rating last updated on 08 May 2026. While the rating change occurred on that date, the analysis and financial metrics presented here reflect the stock’s current position as of 02 June 2026, providing investors with the most up-to-date insight into the company’s performance and outlook.
Read full news article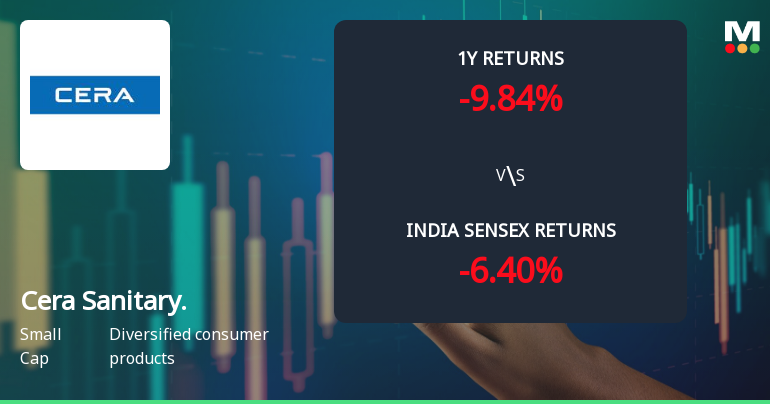
Cera Sanitaryware Ltd Technical Momentum Shifts Amid Mixed Market Signals
Cera Sanitaryware Ltd, a key player in the diversified consumer products sector, has experienced a nuanced shift in its technical momentum, moving from a sideways trend to a mildly bearish stance. Despite a modest day gain of 0.31%, the stock’s technical indicators present a complex picture, with bullish signals on shorter timeframes contrasting with bearish trends on monthly charts. This article analyses the recent technical developments, price momentum, and how these factors align with the company’s broader market performance.
Read full news article Announcements
Disclosures under Reg. 29(2) of SEBI (SAST) Regulations 2011
09-Jun-2026 | Source : BSEThe Exchange has received the disclosure under Regulation 29(2) of SEBI (Substantial Acquisition of Shares & Takeovers) Regulations 2011 for HDFC Life Insurance Co. Ltd
Intimation Under Regulation 30 Of The SEBI (LODR) Regulations 2015
05-Jun-2026 | Source : BSEIntimation of Vesting of Stock Options under Cera Sanitaryware - Employee Stock Option Scheme 2024
Announcement under Regulation 30 (LODR)-Analyst / Investor Meet - Intimation
04-Jun-2026 | Source : BSEIntimation regarding Analyst / Investor Meet to be held on 10th June 2026
Corporate Actions

No Upcoming Board Meetings

Cera Sanitaryware Ltd has declared 1500% dividend, ex-date: 07 Jul 26

No Splits history available

Cera Sanitaryware Ltd has announced 1:1 bonus issue, ex-date: 02 Sep 10

No Rights history available
Quality key factors
Valuation key factors
Technicals key factors
 Technical Indicator Scale: Bearish, Mildly Bearish, Sideways, Mildly Bullish, Bullish Turned
 Shareholding Snapshot : Mar 2026
Shareholding Compare (%holding)
Promoters
None
Held by 16 Schemes (11.94%)
Held by 102 FIIs (14.19%)
Vikram Investment Company Private Limited (22.27%)
Nalanda India Equity Fund Limited (9.57%)
14.19%
Quarterly Results Snapshot (Standalone) - Mar'26 - YoY

YoY Growth in quarter ended Mar 2026 is 11.39% vs 5.73% in Mar 2025

YoY Growth in quarter ended Mar 2026 is -9.63% vs 14.06% in Mar 2025
Half Yearly Results Snapshot (Standalone) - Sep'25
Growth in half year ended Sep 2025 is 2.18% vs -0.09% in Sep 2024
Growth in half year ended Sep 2025 is -10.31% vs 1.57% in Sep 2024
Nine Monthly Results Snapshot (Standalone) - Dec'25
YoY Growth in nine months ended Dec 2025 is 5.16% vs 0.89% in Dec 2024
YoY Growth in nine months ended Dec 2025 is -21.16% vs -1.97% in Dec 2024
Annual Results Snapshot (Standalone) - Mar'26
YoY Growth in year ended Mar 2026 is 7.04% vs 2.35% in Mar 2025
YoY Growth in year ended Mar 2026 is -17.16% vs 3.06% in Mar 2025
About Cera Sanitaryware Ltd

Company Coordinates


