
Compare Cerebra Integr. with Similar Stocks
Dashboard
With a Operating Losses, the company has a Weak Long Term Fundamental Strength
- Company's ability to service its debt is weak with a poor EBIT to Interest (avg) ratio of -2.68
- The company has been able to generate a Return on Equity (avg) of 2.35% signifying low profitability per unit of shareholders funds
The company has declared Negative results for the last 6 consecutive quarters
Risky - Negative EBITDA
Below par performance in long term as well as near term
Stock DNA
IT - Hardware
INR 38 Cr (Micro Cap)
NA (Loss Making)
37
0.00%
0.47
-66.42%
0.41
Total Returns (Price + Dividend) 
Cerebra Integr. for the last several years.
Risk Adjusted Returns v/s
Returns Beta

News
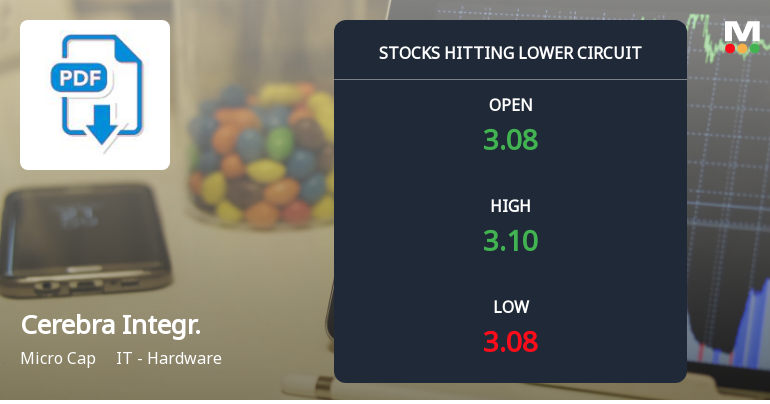
Cerebra Integrated Technologies Ltd Locks at Lower Circuit With 3.13% Loss — Sellers Queue, No Buyers in Sight
At Rs 3.10, Cerebra Integrated Technologies Ltd locked at its lower circuit on 13 Jul 2026, falling 3.13% within a 5% price band. Sellers were lined up, but buyers were absent, resulting in unfilled supply and a frozen price that capped losses for the day.
Read full news article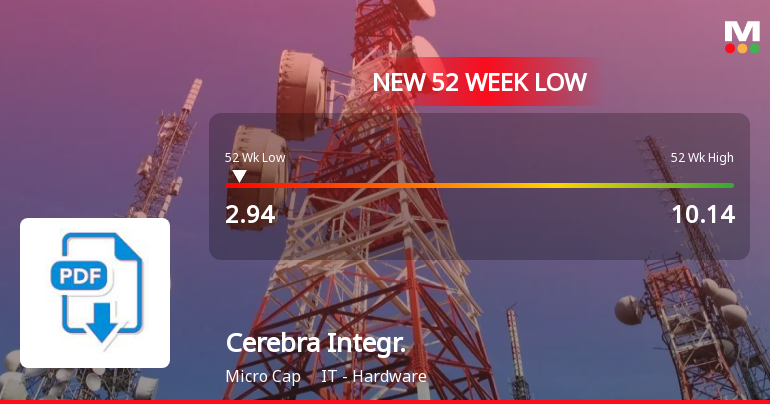
Cerebra Integrated Technologies Ltd Falls to 52-Week Low of Rs 2.94 as Sell-Off Deepens
A sharp decline over the past two sessions has dragged Cerebra Integrated Technologies Ltd to a fresh 52-week low of Rs 2.94 on 8 Jul 2026, marking a near 60% drop over the last year and signalling sustained pressure on this micro-cap IT hardware stock.
Read full news article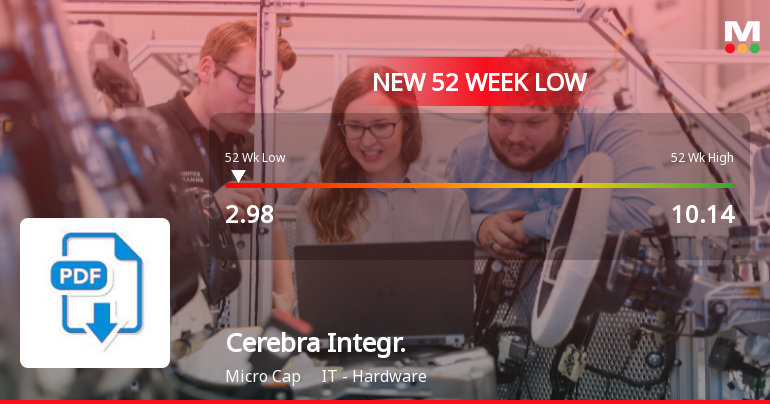
Cerebra Integrated Technologies Ltd Falls to 52-Week Low of Rs 2.98 as Sell-Off Deepens
A 3.28% gain over the past two sessions has done little to reverse the steep decline that has pushed Cerebra Integrated Technologies Ltd to a fresh 52-week low of Rs 2.98 on 7 Jul 2026, marking a near 71% drop from its 52-week high of Rs 10.14. This micro-cap stock in the IT - Hardware sector has been under sustained selling pressure despite a modest outperformance against its sector today.
Read full news article Announcements
Cerebra Integrated Technologies Limited - Clarification
18-Nov-2019 | Source : NSECerebra Integrated Technologies Limited Limited with respect to announcement dated 13-Nov-2019, regardingá Board meeting held on November 12, 2019.á áOn basis of above the Company is required to clarify following: 1. Brief profileá
Cerebra Integrated Technologies Limited - Outcome of Board Meeting
13-Nov-2019 | Source : NSECerebra Integrated Technologies Limited has informed the Exchange regarding Board meeting held on November 12, 2019.
Cerebra Integrated Technologies Limited - Shareholders meeting
26-Sep-2019 | Source : NSECerebra Integrated Technologies Limited has informed the Exchange regarding Proceedings of Annual General Meeting held on September 25, 2019
Corporate Actions

No Upcoming Board Meetings

No Dividend history available

No Splits history available

No Bonus history available

No Rights history available
Quality key factors
Valuation key factors
Technicals key factors
 Technical Indicator Scale: Bearish, Mildly Bearish, Sideways, Mildly Bullish, Bullish Turned
 Shareholding Snapshot : Mar 2026
Shareholding Compare (%holding)
Non Institution
None
Held by 0 Schemes
Held by 1 FIIs (0.0%)
V Ranganathan (0.66%)
Dhanlaxmi Jaswantrai Mehta (4.37%)
75.69%
Quarterly Results Snapshot (Consolidated) - Mar'26 - QoQ

QoQ Growth in quarter ended Mar 2026 is 39.02% vs -62.90% in Dec 2025

QoQ Growth in quarter ended Mar 2026 is -85.97% vs -73.58% in Dec 2025
Half Yearly Results Snapshot (Consolidated) - Sep'25
Growth in half year ended Sep 2025 is -82.11% vs -9.80% in Sep 2024
Growth in half year ended Sep 2025 is 24.00% vs -27.55% in Sep 2024
Nine Monthly Results Snapshot (Consolidated) - Dec'25
YoY Growth in nine months ended Dec 2025 is -85.44% vs -9.98% in Dec 2024
YoY Growth in nine months ended Dec 2025 is -2.43% vs 27.16% in Dec 2024
Annual Results Snapshot (Consolidated) - Mar'26
YoY Growth in year ended Mar 2026 is -83.30% vs -31.47% in Mar 2025
YoY Growth in year ended Mar 2026 is -51.61% vs 2.21% in Mar 2025
About Cerebra Integrated Technologies Ltd

Company Coordinates


