Chamanlal Setia

  • Market Cap: Micro Cap
  • Industry: Other Agricultural Products
  • ISIN: INE419D01026
  • NSEID: CLSEL
  • BSEID: 530307
INR
275.25
-18.75 (-6.38%)
BSENSE

Aug 07, 03:32 PM

BSE+NSE Vol: 2.03 lacs

  • Price Points
  • Score
  • Mojo Parameters
  • Total Return
  • News and Corporate Actions
  • Key factors
  • Shareholding
  • Financials
  • CompanyCV
stock-summaryPrice Point
High/Low

1Day

52 Week

Valuation
Technical
Day's Volume

CASH

2.03 lacs (64.94%) Volume

Shareholding (Jun 2026)

FII

3.30%

Held by 9 FIIs

DII

1.57%

Held by 0 DIIs

Promoter

74.05%

Why is Chamanlal Setia Exports Ltd falling/rising?

07-Aug-2026

As of 06-Aug, Chamanlal Setia Exports Ltd's stock price is Rs 294.00, reflecting a slight increase and strong performance with a 5.00% gain over the past week, outperforming the Sensex. The stock is trading above key moving averages, indicating a positive trend and increased investor interest.

As of 06-Aug, Chamanlal Setia Exports Ltd is experiencing a slight rise in its stock price, currently at Rs 294.00, with a change of 0.05 (0.02%) upwards. The stock has shown strong performance over the past week, gaining 5.00%, which significantly outpaces the Sensex's increase of 1.32% during the same period. Additionally, the stock has risen by 1.62% over the past month, again outperforming the benchmark index.<BR><BR>Today, the stock has outperformed its sector by 0.37% and has been on a consecutive gain streak for the last two days, accumulating a total return of 1.55% in that timeframe. It reached an intraday high of Rs 302.95, reflecting a 3.06% increase at its peak. Furthermore, Chamanlal Setia Exports Ltd is trading above its 5-day, 20-day, 50-day, 100-day, and 200-day moving averages, indicating a positive trend in its price movement.<BR><BR>Investor participation has also increased, with delivery volume rising by 83.24% compared to the 5-day average, suggesting heightened interest in the stock. The liquidity of the stock is adequate, allowing for trades of Rs 0.06 crore based on 2% of the 5-day average traded value. Overall, these factors contribute to the stock's upward movement.

View full answer

When is the next results date for Chamanlal Setia Exports Ltd?

23-Jul-2026

The next results date for Chamanlal Setia Exports Ltd is August 6, 2026.

The next results date for Chamanlal Setia Exports Ltd is scheduled for August 6, 2026.

View full answer

How big is Chamanlal Setia?

11-Jun-2026

As of 10th June, Chamanlal Setia Exports Ltd has a market capitalization of 1,344.00 Cr and reported net sales of 1,439.58 Cr and net profit of 114.78 Cr over the latest four quarters.

As of 10th June, <BR><BR>Market Cap: Chamanlal Setia Exports Ltd has a market capitalization of 1,344.00 Cr, classified as a Micro Cap.<BR><BR>Recent Quarterly Performance: The sum of Net Sales for the latest 4 quarters is 1,439.58 Cr, while the sum of Net Profit for the same period is 114.78 Cr.<BR><BR>Balance Sheet Snapshot: The reporting period for the balance sheet is March 2025, with Shareholder's Funds amounting to 733.27 Cr and Total Assets totaling 967.78 Cr.

View full answer

Who are in the management team of Chamanlal Setia?

11-Jun-2026

The management team of Chamanlal Setia includes Vijay Setia (Chairman & Managing Director), Rajeev Setia (Joint Managing Director & CFO), Ankit Setia, Sankesh Setia (Whole-time Directors), Shweta Setia (Executive Director), and several Independent Directors, along with Kanika Nevtia as Company Secretary. They oversee the company's strategic direction and management.

The management team of Chamanlal Setia includes the following key individuals:<BR><BR>1. **Vijay Setia** - Chairman & Managing Director<BR>2. **Rajeev Setia** - Joint Managing Director & CFO<BR>3. **Ankit Setia** - Whole-time Director<BR>4. **Sankesh Setia** - Whole-time Director<BR>5. **Shweta Setia** - Executive Director<BR>6. **Raghav Peshawaria** - Independent Director<BR>7. **Amar Jyoti Bagga** - Independent Director<BR>8. **Vijay Kumar Jhamp** - Independent Director<BR>9. **Arun Kumar Verma** - Independent Director<BR>10. **Pooja Kukar** - Independent Director<BR>11. **Kanika Nevtia** - Company Secretary & Compliance Officer<BR><BR>This team is responsible for the strategic direction and management of the company.

View full answer

Who are the peers of the Chamanlal Setia?

11-Jun-2026

Chamanlal Setia's peers include KRBL, Guj. Ambuja Exp, Kaveri Seed Co., and others, with average management risk and a 1-year return of -26.65%. Guj. Ambuja Exp leads with a 30.27% return, while GRM Overseas has the lowest at -24.12%.

Peers: The peers of Chamanlal Setia are KRBL, Guj. Ambuja Exp, Kaveri Seed Co., Sanstar, GRM Overseas, Gulshan Polyols, AVT Natural Prod, Krishival Foods, and Bombay Super Hyb.<BR><BR>Quality Snapshot: Excellent management risk is observed at Kaveri Seed Co., AVT Natural Prod, and the rest. Average management risk is found at KRBL, Guj. Ambuja Exp, GRM Overseas, Gulshan Polyols, and the rest. Below Average management risk is noted at Sanstar, while Chamanlal Setia also has Average management risk. In terms of growth, Excellent growth is seen at Krishival Foods, while Below Average growth is present at KRBL, Guj. Ambuja Exp, Kaveri Seed Co., Sanstar, GRM Overseas, Chamanlal Setia, Gulshan Polyols, and the rest. Average growth is noted at Bombay Super Hyb. Lastly, Excellent capital structure is held by KRBL, Kaveri Seed Co., Chamanlal Setia, AVT Natural Prod, and the rest, while Below Average capital structure is observed at GRM Overseas, Gulshan Polyols, and the rest.<BR><BR>Return Snapshot: The peer with the highest 1-year return is Guj. Ambuja Exp at 30.27%, while GRM Overseas has the lowest at -24.12%. Chamanlal Setia's 1-year return is -26.65%, which is lower than both of these peers. Additionally, GRM Overseas and Kaveri Seed Co. have negative six-month returns.

View full answer

What does Chamanlal Setia do?

10-Jun-2026

Chamanlal Setia Exports Ltd is a micro-cap company established in 1974, specializing in the milling and processing of basmati rice. As of March 2026, it reported net sales of 428 Cr and a net profit of 38 Cr, with a market cap of INR 1,344 Cr.

Overview:<BR>Chamanlal Setia Exports Ltd is engaged in the milling and processing of basmati rice and operates within the Other Agricultural Products industry, classified as a Micro Cap company.<BR><BR>History:<BR>The company was established in 1974 and incorporated as a Partnership Firm in 1983. It was reconstituted as a Public Limited Company on 21 September 1994. The latest reported quarterly results indicate net sales and net profit for the period ending March 2026.<BR><BR>Financial Snapshot:<BR>Most recent Net Sales: 428 Cr (Quarterly Results - Mar 2026) <BR>Most recent Net Profit: 38 Cr (Quarterly Results - Mar 2026) <BR>Market-cap value: INR 1,344 Cr (Micro Cap)<BR><BR>Key Metrics:<BR>P/E: 12.00 <BR>Industry P/E: 14 <BR>Dividend Yield: 0.91% <BR>Debt Equity: -0.34 <BR>Return on Equity: 15.10% <BR>Price to Book: 1.79 <BR><BR>Contact Details:<BR>Address: Meerankot Road, P O Central Jail Ajnala Road Amritsar Punjab : 143002 <BR>Tel: 91-183-2590318/2592708 <BR>Email: clsetia@rediffmail.com <BR>Website: http://www.maharanirice.in

View full answer

Should I buy, sell or hold Chamanlal Setia Exports Ltd?

03-Jun-2026

Are Chamanlal Setia Exports Ltd latest results good or bad?

27-May-2026

Chamanlal Setia Exports Ltd's latest results show strong profitability with a 55.89% increase in net profit and a 16.50% rise in net sales year-on-year, but a slight sequential decline in sales and ongoing growth challenges have led to an 18.57% drop in stock price over the past year, indicating caution for investors.

Chamanlal Setia Exports Ltd's latest results present a mixed picture. On the positive side, the company reported a net profit of ₹38.27 crore for Q4 FY26, reflecting a significant year-on-year increase of 55.89%. Additionally, net sales reached ₹428.37 crore, marking a 16.50% increase compared to the same quarter last year, and the operating margin improved to a record high of 12.13%.<BR><BR>However, there are notable concerns. The sequential decline in net sales of 0.61% from the previous quarter suggests that growth momentum may be stalling. Furthermore, the company's five-year sales CAGR of 10.18% and operating profit growth of just 3.86% indicate ongoing structural challenges in achieving sustained growth. <BR><BR>The market has reacted negatively, with the stock down 18.57% over the past year, underperforming compared to both the Sensex and its sector peers. This decline raises questions about the company's ability to maintain its recent performance in the face of competitive pressures and market volatility.<BR><BR>In summary, while the quarterly results show strong profitability and operational efficiency, the underlying growth challenges and recent stock performance suggest caution for investors.

View full answer

Is Chamanlal Setia overvalued or undervalued?

17-Nov-2025

As of November 14, 2025, Chamanlal Setia is fairly valued with a PE ratio of 14.34 and a ROCE of 24.82%, underperforming year-to-date at -36.65% compared to the Sensex's 8.22%, but showing strong long-term growth with a 5-year return of 222.45%.

As of 14 November 2025, the valuation grade for Chamanlal Setia has moved from attractive to fair. The company is currently fairly valued based on its financial metrics. Key ratios include a PE ratio of 14.34, an EV to EBITDA of 8.60, and a ROCE of 24.82%. <BR><BR>In comparison to peers, KRBL is rated attractive with a PE of 16.14, while GRM Overseas is considered expensive with a PE of 47.57. Chamanlal Setia's performance has been mixed, with a year-to-date return of -36.65% compared to the Sensex's 8.22%, indicating underperformance in the short term, although it has shown significant growth over the longer term with a 5-year return of 222.45%.

View full answer

How has been the historical performance of Chamanlal Setia?

12-Nov-2025

Chamanlal Setia has shown strong revenue growth with net sales increasing to 1,495.26 Cr in Mar'25, but faced challenges with declining operating profit and profits before and after tax. Despite a slight decrease in total assets and liabilities, cash flow from operating activities improved significantly to 72.00 Cr in Mar'25.

Answer:<BR>The historical performance of Chamanlal Setia shows a trend of increasing net sales and total operating income over the years, with net sales reaching 1,495.26 Cr in Mar'25, up from 1,355.63 Cr in Mar'24 and 1,387.35 Cr in Mar'23. The total expenditure has also risen, amounting to 1,354.18 Cr in Mar'25, compared to 1,193.73 Cr in Mar'24. Operating profit (PBDIT) has seen fluctuations, with a decrease to 149.76 Cr in Mar'25 from 171.47 Cr in Mar'24. Profit before tax decreased to 136.37 Cr in Mar'25 from 154.53 Cr in Mar'24, while profit after tax also fell to 102.88 Cr from 115.64 Cr in the previous year. The company's total assets decreased to 967.78 Cr in Mar'25 from 994.41 Cr in Mar'24, and total liabilities also saw a decline to 967.78 Cr from 994.41 Cr. Cash flow from operating activities improved to 72.00 Cr in Mar'25 from a negative 38.00 Cr in Mar'24, indicating a positive shift in cash generation.<BR><BR>Breakdown:<BR>Chamanlal Setia's financial performance has shown a consistent increase in net sales, which rose from 797.69 Cr in Mar'20 to 1,495.26 Cr in Mar'25, reflecting strong revenue growth. However, total operating income followed a similar trajectory, reaching 1,495.26 Cr in Mar'25. Despite this growth, total expenditure also increased, leading to a decline in operating profit to 149.76 Cr in Mar'25. Profit before tax and profit after tax both decreased in Mar'25, indicating challenges in maintaining profitability amidst rising costs. The company's total assets and liabilities decreased slightly, suggesting a tightening of financial resources. On a positive note, cash flow from operating activities turned positive in Mar'25, highlighting improved cash management and operational efficiency.

View full answer

Is Chamanlal Setia technically bullish or bearish?

10-Nov-2025

As of November 7, 2025, Chamanlal Setia's trend is mildly bearish, with daily moving averages and weekly indicators showing bearish signals, while the weekly MACD and OBV suggest some underlying strength, resulting in a cautious short-term outlook.

As of 7 November 2025, the technical trend has changed from bearish to mildly bearish. The current stance is mildly bearish, driven by the daily moving averages indicating a bearish trend and the weekly KST and Bollinger Bands also showing bearish signals. However, the weekly MACD and OBV are mildly bullish, suggesting some underlying strength. The RSI shows no signal on both weekly and monthly time frames, indicating a lack of momentum. Overall, the mixed signals reflect a cautious outlook for Chamanlal Setia in the short term.

View full answer

Who are the top shareholders of the Chamanlal Setia?

17-Jul-2025

The top shareholders of Chamanlal Setia include Rajeev Setia, who holds 36.62%, followed by 15 Foreign Institutional Investors with 2.01%, and Altitude Investment Fund Pcc-cell 1 at 1.63%. Individual investors own 16.58%, with no pledged promoter holdings or mutual fund investments.

The top shareholders of Chamanlal Setia include the promoters, with Rajeev Setia holding the highest stake at 36.62%. Additionally, there are 15 Foreign Institutional Investors (FIIs) who collectively hold 2.01% of the company. The highest public shareholder is Altitude Investment Fund Pcc-cell 1, which holds 1.63%. Individual investors collectively own 16.58% of the shares. There are no pledged promoter holdings, and no mutual funds are currently holding shares in the company.

View full answer

What is the bonus history of the Chamanlal Setia?

06-Jun-2025

Chamanlal Setia Exports Ltd issued a bonus of 1:10 on October 14, 2016, meaning shareholders received 1 additional share for every 10 shares held, with a record date of October 17, 2016.

Chamanlal Setia Exports Ltd has a bonus history that includes a bonus issue of 1:10, which was announced with an ex-date of October 14, 2016. The record date for this bonus was October 17, 2016. This means that for every 10 shares held, shareholders received 1 additional share as a bonus. If you have any more questions about the company or its financial activities, feel free to ask!

View full answer

Has Chamanlal Setia declared dividend?

06-Jun-2025

Yes, Chamanlal Setia Exports Ltd has declared a dividend of 112% (₹2.24 per share) with an ex-date of September 20, 2024. The company has shown strong total returns over various periods, particularly in the long term.

Chamanlal Setia Exports Ltd has declared a dividend.<BR><BR>Dividend Details:<BR>- Percentage announced: 112%<BR>- Amount per share: 2.24<BR>- Ex-date: 20 Sep 24<BR><BR>Dividend Yield: 0.62%<BR><BR>Total Returns by Period:<BR>In the last 6 months, the price return was 4.35%, with no dividend return, resulting in a total return of 4.35%.<BR><BR>Over the past year, the price return was 80.62%, with a dividend return of 1.08%, leading to a total return of 81.7%.<BR><BR>In the 2-year period, the price return was 107.22%, with a dividend return of 1.82%, culminating in a total return of 109.04%.<BR><BR>For the 3-year period, the price return was 245.17%, with a dividend return of 3.42%, resulting in a total return of 248.59%.<BR><BR>During the last 4 years, the price return was 180.92%, with a dividend return of 2.95%, leading to a total return of 183.87%.<BR><BR>In the 5-year period, the price return was 731.24%, with a dividend return of 6.77%, resulting in a total return of 738.01%.<BR><BR>Overall, Chamanlal Setia Exports Ltd has declared a significant dividend, and the total returns over various periods indicate strong performance, particularly in the longer term, highlighting the company's growth potential and shareholder value.

View full answer
iScoreScore
Click here to find our call on this stock
Strong Sell
Sell
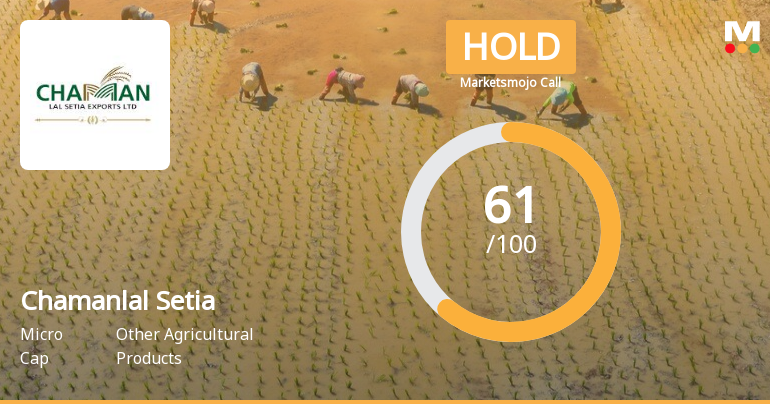
Hold
Buy
Strong Buy

Dashboard

1

Company has a Debt to Equity ratio (avg) of 0.04 times

 
2

Poor long term growth as Net Sales has grown by an annual rate of 11.07% and Operating profit at 6.16% over the last 5 years

 
3

The company has declared Positive results for the last 3 consecutive quarters

4

With ROE of 15.1, it has a Very Expensive valuation with a 1.9 Price to Book Value

5

Despite the size of the company, domestic mutual funds hold only 0% of the company

6

Below par performance in long term as well as near term

stock-summaryMojo Parameters

Mojo Parameters

Loading Valuation Snapshot...

Stock DNA

stock-summary
Industry

Other Agricultural Products

stock-summary
Market cap

INR 1,369 Cr (Micro Cap)

stock-summary
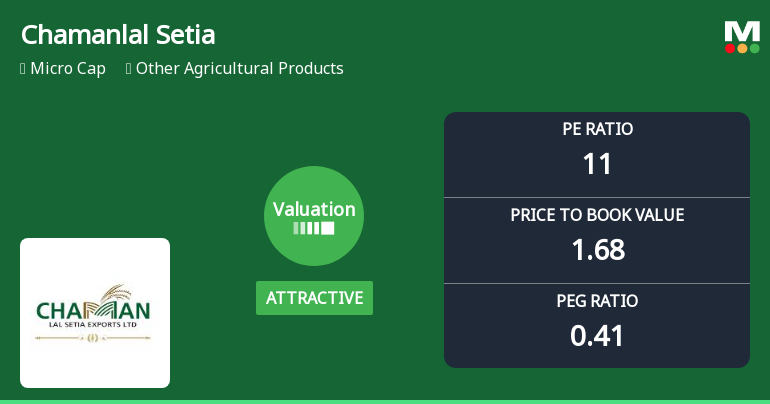
P/E

13.00

stock-summary
Industry P/E

14

stock-summary
Dividend Yield

0.85%

stock-summary
Debt Equity

-0.34

stock-summary
Return on Equity

15.10%

stock-summary
Price to Book

1.93

Revenue and Profits:
Net Sales:
346 Cr
(Quarterly Results - Jun 2026)
Net Profit:
32 Cr
stock-summaryTotal Returns
Total Returns (Price + Dividend) stock-summary
Dividend Yield (0.85%)
TimePeriod
Price Return
Dividend Return
Total Return
3 Months
-7.82%
0%
-7.82%
6 Months
2.78%
0%
2.78%
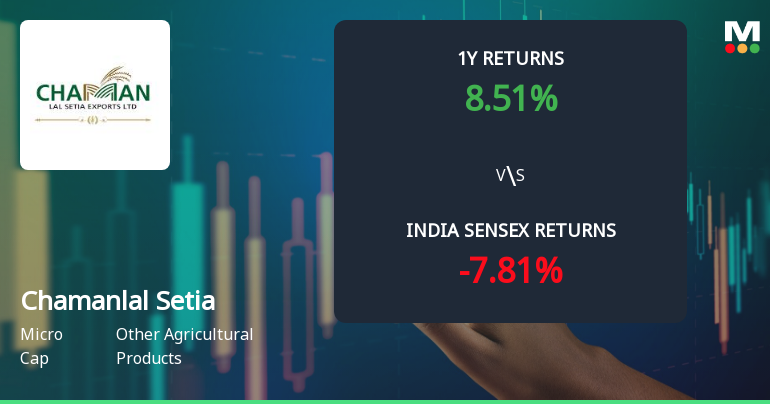
1 Year
-5.18%
0.86%
-4.32%
2 Years
17.65%
1.93%
19.58%
3 Years
33.84%
2.69%
36.53%
4 Years
157.0%
5.54%
162.54%
5 Years
88.66%
5.39%
94.05%

Latest dividend: 2.5 per share ex-dividend date: Sep-15-2025

Risk Adjusted Returns v/s stock-summary
Returns Beta
Icon
Beta has not been calculated since enough price history is not available
stock-summaryNews & Corporate Actions

Announcements stock-summary

Announcement under Regulation 30 (LODR)-Analyst / Investor Meet - Intimation

31-Jul-2026 | Source : BSE

REVISED INTIMATION FOR CONCALL TO BE HELD ON 07.08.2026 AT 12:00PM AND ITS LINK IS https://events.kaptify.in/CLSEL-Q1FY27-ConcallRegn

Announcement under Regulation 30 (LODR)-Analyst / Investor Meet - Intimation

30-Jul-2026 | Source : BSE

INTIMATION OF INVESTOR CALL TO BE HELD ON 07.08.2026 VIDE LINK https://events.kaptify.in/CLSEL-Q1FY27-ConcallRegn

Board Meeting Intimation for INTIMATION OF BOARD MEETING

22-Jul-2026 | Source : BSE

Chaman Lal Setia Exports Ltd-has informed BSE that the meeting of the Board of Directors of the Company is scheduled on 06/08/2026 inter alia to consider and approve BOARD MEETING INTIMATION FOR APPROVAL OF UN-AUDITED FINANCIAL RESULTS FOR QUARTER ENDED 30.06.2026.

Corporate Actions stock-summary

stock-summary
BOARD MEETING

No Upcoming Board Meetings

stock-summary
DIVIDEND

Chamanlal Setia Exports Ltd has declared 125% dividend, ex-date: 15 Sep 25

stock-summary
SPLITS

Chamanlal Setia Exports Ltd has announced 2:10 stock split, ex-date: 28 Dec 15

stock-summary
BONUS

Chamanlal Setia Exports Ltd has announced 1:10 bonus issue, ex-date: 14 Oct 16

stock-summary
RIGHTS

No Rights history available

stock-summaryKey Factors

Quality key factors stock-summary

Factor
Value
Sales Growth (5y)
11.07%
EBIT Growth (5y)
6.16%
EBIT to Interest (avg)
16.17
Debt to EBITDA (avg)
0.71
Net Debt to Equity (avg)
-0.34
Sales to Capital Employed (avg)
2.00
Tax Ratio
25.36%
Dividend Payout Ratio
12.08%
Pledged Shares
0
Institutional Holding
4.88%
ROCE (avg)
26.40%
ROE (avg)
18.22%

Valuation key factors

Factor
Value
P/E Ratio
13
Industry P/E
14
Price to Book Value
1.93
EV to EBIT
7.94
EV to EBITDA
7.71
EV to Capital Employed
2.42
EV to Sales
0.84
PEG Ratio
0.80
Dividend Yield
0.85%
ROCE (Latest)
24.82%
ROE (Latest)
15.10%

Technicals key factors

Indicator
Weekly
Monthly
MACD
Mildly Bearish
Mildly Bearish
RSI
No Signal
No Signal
Bollinger Bands
Bullish
Bullish
Moving Averages
Bullish (Daily)
KST
Mildly Bearish
Bearish
Dow Theory
Mildly Bullish
Mildly Bearish
OBV
Mildly Bullish
Mildly Bearish
stock-summary Technical Indicator Scale: Bearish, Mildly Bearish, Sideways, Mildly Bullish, Bullish  Turned 
stock-summaryShareholding
Shareholding Snapshot : Jun 2026stock-summary
Shareholding Compare (%holding) stock-summary
Majority shareholders

Promoters

Pledged Promoter Holdings

None

Mutual Funds

Held by 0 Schemes

FIIs

Held by 9 FIIs (3.3%)

Promoter with highest holding

Rajeev Setia (36.62%)

Highest Public shareholder

Altitude Investment Fund Pcc (2.98%)

Individual Investors Holdings

16.61%

stock-summaryFinancial
[
  {
    "link": "quarterly",
    "btn_text": "All Quarterly Results",
    "header": "Quarterly Results Snapshot (Standalone) - Jun'26 - QoQ",
    "rhs": [
      {
        "prefix": "Net Sales ",
        "suffix": "QoQ Growth in quarter ended Jun 2026 is -19.25% vs -0.61% in Mar 2026",
        "dir": -1
      },
      {
        "prefix": "Standalone Net Profit ",
        "suffix": "QoQ Growth in quarter ended Jun 2026 is -16.41% vs 6.48% in Mar 2026",
        "dir": -1
      }
    ],
    "table": {
      "header": [
        "Jun'26",
        "Mar'26",
        "Change(%)"
      ],
      "body": [
        {
          "field": "Net Sales",
          "val1": "345.92",
          "val2": "428.37",
          "chgp": "-19.25%",
          "chgp_class": "negative"
        },
        {
          "field": "Operating Profit (PBDIT) excl Other Income",
          "val1": "43.55",
          "val2": "51.97",
          "chgp": "-16.20%",
          "chgp_class": "negative"
        },
        {
          "field": "Interest",
          "val1": "1.76",
          "val2": "3.19",
          "chgp": "-44.83%",
          "chgp_class": "positive"
        },
        {
          "field": "Exceptional Items",
          "val1": "0.00",
          "val2": "0.00",
          "chgp": "",
          "chgp_class": "neutral"
        },
        {
          "field": "Standalone Net Profit",
          "val1": "31.99",
          "val2": "38.27",
          "chgp": "-16.41%",
          "chgp_class": "negative"
        },
        {
          "field": "Operating Profit Margin (Excl OI)",
          "val1": "12.59%",
          "val2": "12.13%",
          "chgp": "0.46%",
          "chgp_class": "positive"
        }
      ]
    }
  },
  {
    "link": "half-yearly",
    "btn_text": "All Half Yearly Results",
    "header": "Half Yearly Results Snapshot (Standalone) - Sep'25",
    "rhs": [
      {
        "prefix": "Net Sales ",
        "suffix": " Growth in half year ended Sep 2025 is -20.76% vs 28.01% in Sep 2024",
        "dir": -1
      },
      {
        "prefix": "Standalone Net Profit ",
        "suffix": " Growth in half year ended Sep 2025 is -17.74% vs -8.16% in Sep 2024",
        "dir": -1
      }
    ],
    "table": {
      "header": [
        "Sep'25",
        "Sep'24",
        "Change(%)"
      ],
      "body": [
        {
          "field": "Net Sales",
          "val1": "580.22",
          "val2": "732.27",
          "chgp": "-20.76%",
          "chgp_class": "negative"
        },
        {
          "field": "Operating Profit (PBDIT) excl Other Income",
          "val1": "53.69",
          "val2": "68.20",
          "chgp": "-21.28%",
          "chgp_class": "negative"
        },
        {
          "field": "Interest",
          "val1": "3.73",
          "val2": "3.32",
          "chgp": "12.35%",
          "chgp_class": "negative"
        },
        {
          "field": "Exceptional Items",
          "val1": "0.00",
          "val2": "0.00",
          "chgp": "",
          "chgp_class": "neutral"
        },
        {
          "field": "Standalone Net Profit",
          "val1": "40.57",
          "val2": "49.32",
          "chgp": "-17.74%",
          "chgp_class": "negative"
        },
        {
          "field": "Operating Profit Margin (Excl OI)",
          "val1": "9.25%",
          "val2": "9.31%",
          "chgp": "-0.06%",
          "chgp_class": "negative"
        }
      ]
    }
  },
  {
    "link": "nine-monthly",
    "btn_text": "All Nine Monthly Results",
    "header": "Nine Monthly Results Snapshot (Standalone) - Dec'25",
    "rhs": [
      {
        "prefix": "Net Sales ",
        "suffix": "YoY Growth in nine months ended Dec 2025 is -10.32% vs 15.99% in Dec 2024",
        "dir": -1
      },
      {
        "prefix": "Standalone Net Profit ",
        "suffix": "YoY Growth in nine months ended Dec 2025 is -2.32% vs -15.22% in Dec 2024",
        "dir": 1
      }
    ],
    "table": {
      "header": [
        "Dec'25",
        "Dec'24",
        "Change(%)"
      ],
      "body": [
        {
          "field": "Net Sales",
          "val1": "1,011.21",
          "val2": "1,127.57",
          "chgp": "-10.32%",
          "chgp_class": "negative"
        },
        {
          "field": "Operating Profit (PBDIT) excl Other Income",
          "val1": "104.76",
          "val2": "107.71",
          "chgp": "-2.74%",
          "chgp_class": "negative"
        },
        {
          "field": "Interest",
          "val1": "5.83",
          "val2": "5.07",
          "chgp": "14.99%",
          "chgp_class": "negative"
        },
        {
          "field": "Exceptional Items",
          "val1": "0.00",
          "val2": "0.00",
          "chgp": "",
          "chgp_class": "neutral"
        },
        {
          "field": "Standalone Net Profit",
          "val1": "76.51",
          "val2": "78.33",
          "chgp": "-2.32%",
          "chgp_class": "negative"
        },
        {
          "field": "Operating Profit Margin (Excl OI)",
          "val1": "10.36%",
          "val2": "9.55%",
          "chgp": "0.81%",
          "chgp_class": "positive"
        }
      ]
    }
  },
  {
    "link": "annual",
    "btn_text": "All Annual Results",
    "header": "Annual Results Snapshot (Standalone) - Mar'26",
    "rhs": [
      {
        "prefix": "Net Sales ",
        "suffix": "YoY Growth in year ended Mar 2026 is -3.72% vs 10.30% in Mar 2025",
        "dir": -1
      },
      {
        "prefix": "Standalone Net Profit ",
        "suffix": "YoY Growth in year ended Mar 2026 is 11.57% vs -11.03% in Mar 2025",
        "dir": 1
      }
    ],
    "table": {
      "header": [
        "Mar'26",
        "Mar'25",
        "Change(%)"
      ],
      "body": [
        {
          "field": "Net Sales",
          "val1": "1,439.58",
          "val2": "1,495.26",
          "chgp": "-3.72%",
          "chgp_class": "negative"
        },
        {
          "field": "Operating Profit (PBDIT) excl Other Income",
          "val1": "156.73",
          "val2": "141.08",
          "chgp": "11.09%",
          "chgp_class": "positive"
        },
        {
          "field": "Interest",
          "val1": "9.02",
          "val2": "9.77",
          "chgp": "-7.68%",
          "chgp_class": "positive"
        },
        {
          "field": "Exceptional Items",
          "val1": "0.00",
          "val2": "0.00",
          "chgp": "",
          "chgp_class": "neutral"
        },
        {
          "field": "Standalone Net Profit",
          "val1": "114.78",
          "val2": "102.88",
          "chgp": "11.57%",
          "chgp_class": "positive"
        },
        {
          "field": "Operating Profit Margin (Excl OI)",
          "val1": "10.89%",
          "val2": "9.44%",
          "chgp": "1.45%",
          "chgp_class": "positive"
        }
      ]
    }
  }
]

Quarterly Results Snapshot (Standalone) - Jun'26 - QoQstock-summary

Jun'26
Mar'26
Change(%)
Net Sales
345.92
428.37
-19.25%
Operating Profit (PBDIT) excl Other Income
43.55
51.97
-16.20%
Interest
1.76
3.19
-44.83%
Exceptional Items
0.00
0.00
Standalone Net Profit
31.99
38.27
-16.41%
Operating Profit Margin (Excl OI)
12.59%
12.13%
0.46%
Values in Rs Cr.
Direction Arrows
Net Sales

QoQ Growth in quarter ended Jun 2026 is -19.25% vs -0.61% in Mar 2026

Direction Arrows
Standalone Net Profit

QoQ Growth in quarter ended Jun 2026 is -16.41% vs 6.48% in Mar 2026

Half Yearly Results Snapshot (Standalone) - Sep'25stock-summary

Sep'25
Sep'24
Change(%)
Net Sales
580.22
732.27
-20.76%
Operating Profit (PBDIT) excl Other Income
53.69
68.20
-21.28%
Interest
3.73
3.32
12.35%
Exceptional Items
0.00
0.00
Standalone Net Profit
40.57
49.32
-17.74%
Operating Profit Margin (Excl OI)
9.25%
9.31%
-0.06%
Values in Rs Cr.
Direction Arrows
Net Sales

Growth in half year ended Sep 2025 is -20.76% vs 28.01% in Sep 2024

Direction Arrows
Standalone Net Profit

Growth in half year ended Sep 2025 is -17.74% vs -8.16% in Sep 2024

Nine Monthly Results Snapshot (Standalone) - Dec'25stock-summary

Dec'25
Dec'24
Change(%)
Net Sales
1,011.21
1,127.57
-10.32%
Operating Profit (PBDIT) excl Other Income
104.76
107.71
-2.74%
Interest
5.83
5.07
14.99%
Exceptional Items
0.00
0.00
Standalone Net Profit
76.51
78.33
-2.32%
Operating Profit Margin (Excl OI)
10.36%
9.55%
0.81%
Values in Rs Cr.
Direction Arrows
Net Sales

YoY Growth in nine months ended Dec 2025 is -10.32% vs 15.99% in Dec 2024

Direction Arrows
Standalone Net Profit

YoY Growth in nine months ended Dec 2025 is -2.32% vs -15.22% in Dec 2024

Annual Results Snapshot (Standalone) - Mar'26stock-summary

Mar'26
Mar'25
Change(%)
Net Sales
1,439.58
1,495.26
-3.72%
Operating Profit (PBDIT) excl Other Income
156.73
141.08
11.09%
Interest
9.02
9.77
-7.68%
Exceptional Items
0.00
0.00
Standalone Net Profit
114.78
102.88
11.57%
Operating Profit Margin (Excl OI)
10.89%
9.44%
1.45%
Values in Rs Cr.
Direction Arrows
Net Sales

YoY Growth in year ended Mar 2026 is -3.72% vs 10.30% in Mar 2025

Direction Arrows
Standalone Net Profit

YoY Growth in year ended Mar 2026 is 11.57% vs -11.03% in Mar 2025

stock-summaryCompany CV
About Chamanlal Setia Exports Ltd stock-summary
stock-summary
Chamanlal Setia Exports Ltd
Micro Cap
Other Agricultural Products
Chaman Lal Setia Exports Limited was established back in 1974 in Amritsar in Punjab by Late Mr. Chaman Lal Setia. Later on, it was incorporated as a Partnership Firm in 1983 and then reconstituted as a Public Limited Company on 21 September, 1994. The Company is engaged in the business of milling and processing of basmati rice. Founded on the core principles of integrity, trust, honesty and fair dealings, Chaman Lal Setia Exports Ltd.
Company Coordinates stock-summary
Company Details
Meerankot Road, P O Central Jail Ajnala Road Amritsar Punjab : 143002
stock-summary
Tel: 91-183-2590318/2592708
stock-summary
clsetia@rediffmail.com
Registrar Details
Beetal Financial & Computer Services (P) Ltd , Beetal House , 99 Mandangir, 3rd Floor, Behind Local Shopping Centre, Near Dada Harsukhdas Mandir, New Delhi