
Compare CHD Chemicals with Similar Stocks
Dashboard
With a Operating Losses, the company has a Weak Long Term Fundamental Strength
- Low ability to service debt as the company has a high Debt to EBITDA ratio of -5.78 times
- The company has been able to generate a Return on Equity (avg) of 0.95% signifying low profitability per unit of shareholders funds
Flat results in Mar 26
Risky - Negative EBITDA
Stock DNA
Miscellaneous
INR 6 Cr (Micro Cap)
NA (Loss Making)
24
0.00%
0.45
-2.11%
0.46
Total Returns (Price + Dividend) 
Latest dividend: 0.1 per share ex-dividend date: Oct-09-2020
Risk Adjusted Returns v/s
Returns Beta

News
Are CHD Chemicals Ltd latest results good or bad?
CHD Chemicals Ltd's latest financial results for Q4 FY26 reveal a complex picture of operational challenges and modest revenue growth. The company reported net sales of ₹1.53 crores, reflecting a 15.91% sequential improvement from the previous quarter and a 6.25% increase year-on-year. However, despite this revenue growth, the company continued to experience net losses, with a reported loss of ₹0.02 crores, although this was an improvement from a loss of ₹0.05 crores in the prior quarter. The operating margin, excluding other income, stood at -4.58%, which is an improvement from -7.58% in Q3 FY26, yet it remains in negative territory, indicating ongoing operational difficulties. The persistent negative margins raise concerns about the company's ability to generate sustainable profits from its core business activities. CHD Chemicals has faced significant challenges over the past five years, with a cumulati...
Read full news article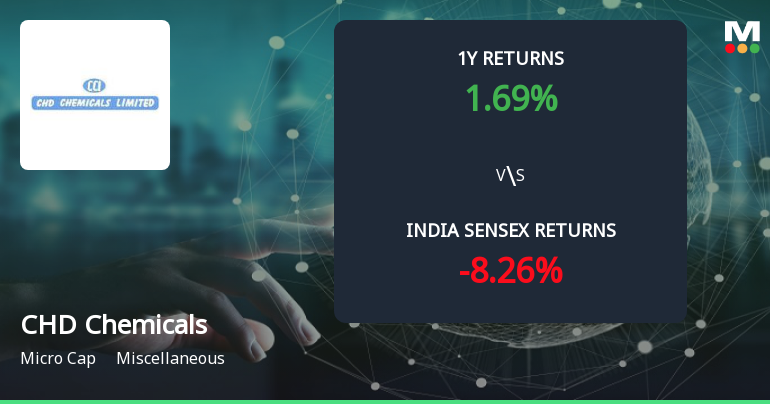
Golden Cross Confirmed: Do CHD Chemicals Ltd's Other Technical Indicators Agree?
The 50-day moving average has crossed above the 200-day moving average for CHD Chemicals Ltd, signalling a golden cross on 2 Jun 2026. Yet, the broader technical and fundamental picture presents a nuanced view that demands careful analysis before drawing conclusions.
Read full news article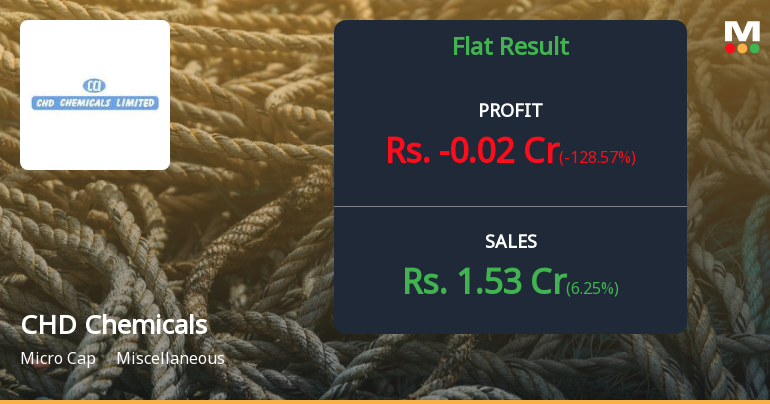
CHD Chemicals Q4 FY26: Persistent Losses Deepen as Revenue Struggles Continue
CHD Chemicals Limited, a Chandigarh-based chemicals and dyes trading company with a market capitalisation of ₹6.00 crores, reported another quarter of losses in Q4 FY26 (Mar'26), posting a net loss of ₹0.02 crores. Whilst this represented a marginal improvement from the ₹0.05 crore loss in Q3 FY26, the company continues to grapple with structural challenges that have plagued its operations for three consecutive quarters. The stock closed at ₹6.00 on June 01, 2026, down 2.44% on the day, reflecting ongoing investor scepticism about the company's ability to return to profitability.
Read full news article Announcements
Declaration Of Quarter And Year End Results 31St March 2026
30-May-2026 | Source : BSEdeclaration of quarter and year end result 31st march 2026
Board Meeting Intimation for Postpone Of Board Meeting
28-May-2026 | Source : BSECHD Chemicals Ltdhas informed BSE that the meeting of the Board of Directors of the Company is scheduled on 30/05/2026 inter alia to consider and approve This is to inform you that the meeting of the Board of Directors of our company which was scheduled to be held on 28th may 2026 for consideration and approval of the financial results for the period ended31st march 2026 has been postponed due to to the non-finalization of accounts and ongoing audit procedures The rescheduled date of the Board Meeting will be 30th May 2026 at 12:00 P.M at the corporate office of the company. This is also submitted & informed that pursuant to the code of conduct framed by the Company for prohibition of insider trading pursuant to the requirement of SEBI (Prohibition of Insider Trading) Regulations 2015 as amended the trading window close period for dealing in securities of the company has commenced from 1st April 2026 and will end on 1st June2026(both days inclusive) for Directors KMPs Designated employees and their immediate relatives.
Board Meeting Intimation for Intimation Of Board Meeting
22-May-2026 | Source : BSECHD Chemicals Ltdhas informed BSE that the meeting of the Board of Directors of the Company is scheduled on 28/05/2026 inter alia to consider and approve intimation of board meeting to be held on 28th may 2026 at 1:00 pm to approve audited financial results for the quarter and year ended 31st March 2026
Corporate Actions

No Upcoming Board Meetings

CHD Chemicals Ltd has declared 1% dividend, ex-date: 09 Oct 20

No Splits history available

No Bonus history available

No Rights history available
Quality key factors
Valuation key factors
Technicals key factors
 Technical Indicator Scale: Bearish, Mildly Bearish, Sideways, Mildly Bullish, Bullish Turned
 Shareholding Snapshot : Mar 2026
Shareholding Compare (%holding)
Non Institution
None
Held by 0 Schemes
Held by 0 FIIs
Divya Kothari (16.36%)
None
67.75%
Quarterly Results Snapshot (Standalone) - Mar'26 - YoY

YoY Growth in quarter ended Mar 2026 is 6.25% vs -66.51% in Mar 2025

YoY Growth in quarter ended Mar 2026 is -128.57% vs 250.00% in Mar 2025
Half Yearly Results Snapshot (Standalone) - Sep'25
Growth in half year ended Sep 2025 is -32.96% vs -55.80% in Sep 2024
Growth in half year ended Sep 2025 is 12.50% vs -220.00% in Sep 2024
Nine Monthly Results Snapshot (Standalone) - Dec'25
YoY Growth in nine months ended Dec 2025 is -31.74% vs -54.36% in Dec 2024
YoY Growth in nine months ended Dec 2025 is 0.00% vs -208.33% in Dec 2024
Annual Results Snapshot (Standalone) - Mar'26
YoY Growth in year ended Mar 2026 is -23.69% vs -57.61% in Mar 2025
YoY Growth in year ended Mar 2026 is -55.00% vs -176.92% in Mar 2025
About CHD Chemicals Ltd

Company Coordinates


