
Compare Chemplast Sanmar with Similar Stocks
Dashboard
Low ability to service debt as the company has a high Debt to EBITDA ratio of 9.86 times
- Low ability to service debt as the company has a high Debt to EBITDA ratio of 9.86 times
- The company has been able to generate a Return on Equity (avg) of 9.92% signifying low profitability per unit of shareholders funds
Poor long term growth as Net Sales has grown by an annual rate of -7.98% and Operating profit at -134.63% over the last 5 years
Risky - Negative Operating Profits
Consistent Underperformance against the benchmark over the last 3 years
Stock DNA
Commodity Chemicals
INR 3,134 Cr (Small Cap)
NA (Loss Making)
47
0.00%
0.76
-7.41%
1.84
Total Returns (Price + Dividend) 
Chemplast Sanmar for the last several years.
Risk Adjusted Returns v/s
Returns Beta

News

Chemplast Sanmar Ltd is Rated Sell
Chemplast Sanmar Ltd is rated 'Sell' by MarketsMOJO, with this rating last updated on 26 May 2026. However, the analysis and financial metrics discussed here reflect the company’s current position as of 12 July 2026, providing investors with an up-to-date view of the stock’s fundamentals, returns, and overall outlook.
Read full news article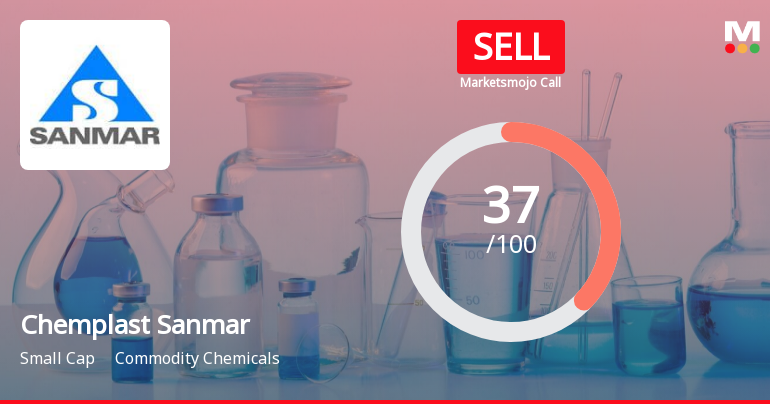
Chemplast Sanmar Ltd is Rated Sell
Chemplast Sanmar Ltd is rated 'Sell' by MarketsMOJO, with this rating last updated on 26 May 2026. However, the analysis and financial metrics discussed here reflect the stock's current position as of 01 July 2026, providing investors with an up-to-date view of the company’s fundamentals, returns, and market standing.
Read full news article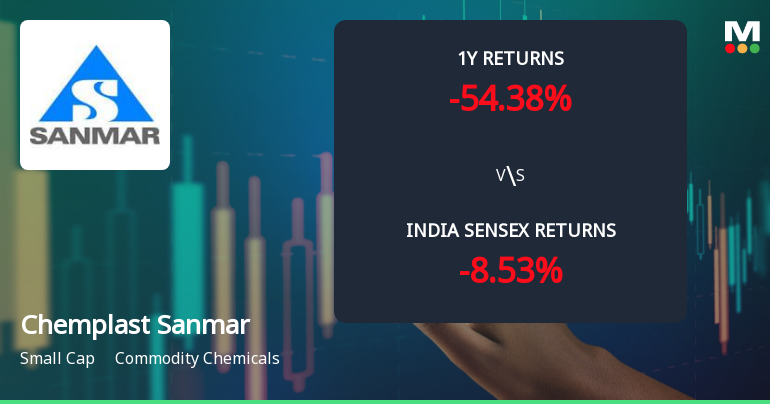
Chemplast Sanmar Ltd Technical Momentum Shifts Amid Prolonged Downtrend
Chemplast Sanmar Ltd, a small-cap player in the commodity chemicals sector, has experienced a notable shift in its technical momentum, reflecting a complex interplay of bearish and mildly bullish signals across multiple timeframes. Despite a recent downgrade in its Mojo Grade to 'Sell' from 'Strong Sell', the stock’s technical indicators reveal nuanced trends that merit close attention from investors navigating volatile market conditions.
Read full news article Announcements
Publish Audited Results
15-May-2012 | Source : NSE| Chemplast Sanmar Limited has informed the Exchange that the Company to publish the audited results for the financial year ended March 31, 2012. |
Sale of Shares
11-May-2012 | Source : NSE| Life Insurance Corporation of India has informed the Exchange vide its letter dated May 07, 2012 that: "As per the guideline on Institutional Transactions in shares issued by Govt. of India on February 20, 1990, we hereby inform that Life Insurance Corporation of India has sold 4,06,58,108 equity shares face value of Rs.1/- each of Chemplast Sanmar Ltd. @ Rs.15/- per share". |
Post Offer Public Announcement
23-Apr-2012 | Source : NSE| Inga Capital Private Limited has submitted to the Exchange a copy of Post Offer Public issued in the Newspaper on April 23, 2012 with respect to the Voluntary Delisting of equity shares ("Equity Shares") of Chemplast Sanmar Limited ("Company"). |
Corporate Actions

No Upcoming Board Meetings

No Dividend history available

Chemplast Sanmar Ltd has announced 1:10 stock split, ex-date: 08 Mar 06

No Bonus history available

Chemplast Sanmar Ltd has announced 2:3 rights issue, ex-date: 17 Mar 09
Quality key factors
Valuation key factors
Technicals key factors
 Technical Indicator Scale: Bearish, Mildly Bearish, Sideways, Mildly Bullish, Bullish Turned
 Shareholding Snapshot : Jun 2026
Shareholding Compare (%holding)
Promoters
None
Held by 9 Schemes (23.3%)
Held by 48 FIIs (12.02%)
Sanmar Holdings Limited (54.99%)
Sbi Small Cap Fund (9.73%)
6.82%
Quarterly Results Snapshot (Consolidated) - Mar'26 - QoQ

QoQ Growth in quarter ended Mar 2026 is 50.34% vs -19.17% in Dec 2025
QoQ Growth in quarter ended Mar 2026 is 61.93% vs -133.54% in Dec 2025
Half Yearly Results Snapshot (Consolidated) - Sep'25

Growth in half year ended Sep 2025 is -0.21% vs 7.74% in Sep 2024
Growth in half year ended Sep 2025 is -1,464.31% vs 80.56% in Sep 2024
Nine Monthly Results Snapshot (Consolidated) - Dec'25
YoY Growth in nine months ended Dec 2025 is -7.10% vs 11.24% in Dec 2024
YoY Growth in nine months ended Dec 2025 is -317.32% vs 55.86% in Dec 2024
Annual Results Snapshot (Consolidated) - Mar'26
YoY Growth in year ended Mar 2026 is -2.81% vs 10.78% in Mar 2025
YoY Growth in year ended Mar 2026 is -153.60% vs 30.34% in Mar 2025
About Chemplast Sanmar Ltd

Company Coordinates


