
Compare Chemplast Sanmar with Similar Stocks
Dashboard
Low ability to service debt as the company has a high Debt to EBITDA ratio of 9.86 times
- Low ability to service debt as the company has a high Debt to EBITDA ratio of 9.86 times
- The company has been able to generate a Return on Equity (avg) of 9.92% signifying low profitability per unit of shareholders funds
Poor long term growth as Net Sales has grown by an annual rate of -7.98% and Operating profit at -134.63% over the last 5 years
Risky - Negative Operating Profits
Consistent Underperformance against the benchmark over the last 3 years
Stock DNA
Commodity Chemicals
INR 3,253 Cr (Small Cap)
NA (Loss Making)
41
0.00%
0.76
-7.41%
1.77
Total Returns (Price + Dividend) 
Chemplast Sanmar for the last several years.
Risk Adjusted Returns v/s
Returns Beta

News
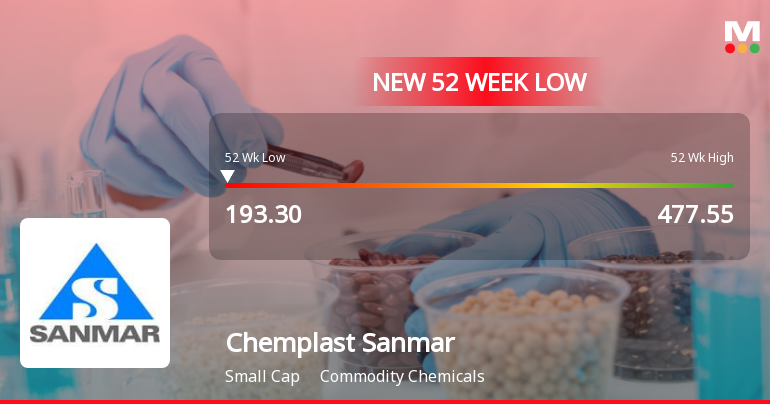
Chemplast Sanmar Ltd Falls to 52-Week Low of Rs 193.3 as Sell-Off Deepens
For the fifth consecutive session, Chemplast Sanmar Ltd closed lower, slipping to a fresh 52-week low of Rs 193.3 on 11 Jun 2026. This marks a steep 59.5% decline from its 52-week high of Rs 477.55, underscoring a persistent downtrend amid broader market weakness.
Read full news article
Chemplast Sanmar Ltd is Rated Sell
Chemplast Sanmar Ltd is rated 'Sell' by MarketsMOJO, with this rating last updated on 26 May 2026. However, the analysis and financial metrics discussed here reflect the stock's current position as of 09 June 2026, providing investors with the latest insights into the company’s performance and outlook.
Read full news article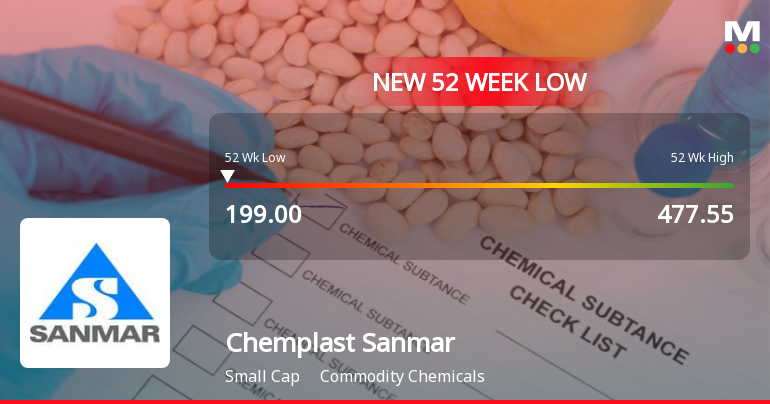
Chemplast Sanmar Ltd Falls to 52-Week Low of Rs 202.4 as Sell-Off Deepens
For the fifth consecutive session, Chemplast Sanmar Ltd closed lower, slipping to a fresh 52-week low of Rs 202.4 on 8 Jun 2026. This marks a steep 57.6% decline from its 52-week high of Rs 477.55, underscoring the persistent pressure on the stock amid broader market weakness and company-specific concerns.
Read full news article Announcements
Announcement under Regulation 30 (LODR)-Earnings Call Transcript
02-Jun-2026 | Source : BSEEarnings conference call Transcript is attached
Commencement Of Commercial Production
28-May-2026 | Source : BSEIntimation regarding commencement of commercial production is enclosed.
Announcement under Regulation 30 (LODR)-Analyst / Investor Meet - Outcome
26-May-2026 | Source : BSEIntimation regarding Audio recordings of earnings conference call held today attached.
Corporate Actions

No Upcoming Board Meetings

No Dividend history available

Chemplast Sanmar Ltd has announced 1:10 stock split, ex-date: 08 Mar 06

No Bonus history available

Chemplast Sanmar Ltd has announced 2:3 rights issue, ex-date: 17 Mar 09
Quality key factors
Valuation key factors
Technicals key factors
 Technical Indicator Scale: Bearish, Mildly Bearish, Sideways, Mildly Bullish, Bullish Turned
 Shareholding Snapshot : Mar 2026
Shareholding Compare (%holding)
Promoters
None
Held by 9 Schemes (23.81%)
Held by 51 FIIs (12.48%)
Sanmar Holdings Limited (54.99%)
Sbi Elss Tax Saver Fund (9.85%)
5.24%
Quarterly Results Snapshot (Consolidated) - Mar'26 - QoQ

QoQ Growth in quarter ended Mar 2026 is 50.34% vs -19.17% in Dec 2025
QoQ Growth in quarter ended Mar 2026 is 61.93% vs -133.54% in Dec 2025
Half Yearly Results Snapshot (Consolidated) - Sep'25

Growth in half year ended Sep 2025 is -0.21% vs 7.74% in Sep 2024
Growth in half year ended Sep 2025 is -1,464.31% vs 80.56% in Sep 2024
Nine Monthly Results Snapshot (Consolidated) - Dec'25
YoY Growth in nine months ended Dec 2025 is -7.10% vs 11.24% in Dec 2024
YoY Growth in nine months ended Dec 2025 is -317.32% vs 55.86% in Dec 2024
Annual Results Snapshot (Consolidated) - Mar'26
YoY Growth in year ended Mar 2026 is -2.81% vs 10.78% in Mar 2025
YoY Growth in year ended Mar 2026 is -153.60% vs 30.34% in Mar 2025
About Chemplast Sanmar Ltd

Company Coordinates


