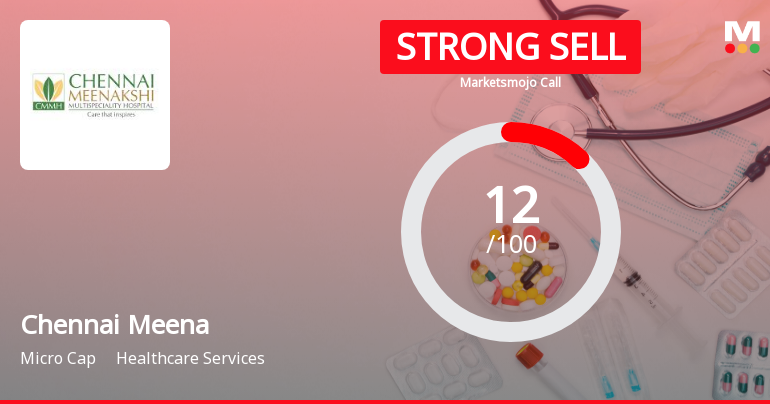
Chennai Meena

  • Market Cap: Micro Cap
  • Industry: Healthcare Services
  • ISIN: INE889F01017
  • NSEID:
  • BSEID: 523489
INR
38.51
-0.39 (-1.0%)
BSENSE

Sep 24, 03:30 PM

BSE+NSE Vol: 63

  • Price Points
  • Score
  • Mojo Parameters
  • Total Return
  • News and Corporate Actions
  • Key factors
  • Shareholding
  • Financials
  • CompanyCV
stock-summaryPrice Point
High/Low

1Day

52 Week

Valuation
Technical
Day's Volume

CASH

63 (-93.47%) Volume

Shareholding (Jun 2026)

FII

0.00%

Held by 0 FIIs

DII

0.14%

Held by 0 DIIs

Promoter

57.10%

Why is Chennai Meenakshi Multispeciality Hospital Ltd falling/rising?

06-Sep-2026

As of 05-Sep, Chennai Meenakshi Multispeciality Hospital Ltd's stock is at Rs 37.50, down 3.55%, and has underperformed the Sensex over various time frames. The stock is in a bearish trend, trading below all key moving averages, with a significant decline in trading volume.

As of 05-Sep, Chennai Meenakshi Multispeciality Hospital Ltd's stock price is falling, currently at Rs 37.50, which reflects a decrease of Rs 1.38 or 3.55%. The stock has been underperforming compared to the benchmark Sensex, showing a decline of 1.94% over the past week, while the Sensex decreased by only 0.97%. Over the last month, the stock has dropped by 2.57%, slightly worse than the Sensex's decline of 2.44%. Year-to-date, the stock is down 18.46%, significantly underperforming the Sensex, which is down 10.21%.<BR><BR>Today, the stock has experienced a consecutive fall for the last two days, resulting in a total decline of 5.85% during this period. It reached an intraday low of Rs 36.31, which represents a drop of 6.61%. The trading volume has also decreased, with delivery volume on September 3 falling by 65.19% compared to the 5-day average. Additionally, the stock is trading below its 5-day, 20-day, 50-day, 100-day, and 200-day moving averages, indicating a bearish trend. Overall, these factors contribute to the stock's downward movement.

View full answer

Who are in the management team of Chennai Meena?

01-Sep-2026

The management team of Chennai Meena consists of R Gomathi (Managing Director), K. Meyyanathan, N. Rajkumar, and Jayanthi Radhakrishnan (all Independent Directors).

The management team of Chennai Meena includes the following members:<BR><BR>1. R Gomathi - Managing Director<BR>2. K. Meyyanathan - Independent Director<BR>3. N. Rajkumar - Independent Director<BR>4. Jayanthi Radhakrishnan - Independent Director<BR><BR>If you need more details about their roles or the company, feel free to ask!

View full answer

What does Chennai Meena do?

01-Sep-2026

Chennai Meenakshi Multispeciality Hospital Ltd, established in 1990 and formerly known as Devaki Hospital, operates in the healthcare sector as a micro-cap company with recent net sales of 9 Cr and a market cap of INR 29 Cr. The company is currently loss-making, with a P/E ratio of N/A and a debt-equity ratio of -1.76.

Overview:<BR>Chennai Meenakshi Multispeciality Hospital Ltd operates in the healthcare services industry and is categorized as a micro-cap company.<BR><BR>History:<BR>The company was incorporated in 1990 and was formerly known as Devaki Hospital Limited until it changed its name in October 2007. The most recent quarterly results report net sales for June 2026.<BR><BR>Financial Snapshot:<BR>- Most recent Net Sales: 9 Cr (Quarterly Results - Jun 2026)<BR>- Most recent Net Profit: N/A<BR>- Market-cap value: INR 29 Cr (Micro Cap)<BR><BR>Key Metrics:<BR>- P/E: N/A (Loss Making)<BR>- Industry P/E: 67<BR>- Dividend Yield: 0.00%<BR>- Debt Equity: -1.76<BR>- Return on Equity: 13.36%<BR>- Price to Book: -9.30<BR><BR>Contact Details:<BR>- Address: New No 70 Old No 149, Luz Church Road Mylapore Chennai Tamil Nadu : 600004<BR>- Tel: 91-044-42938938<BR>- Email: cmmhospitals@gmail.com<BR>- Website: https://cmmh.in

View full answer

Who are the peers of the Chennai Meena?

01-Sep-2026

Chennai Meena's peers include GKB Ophthalmics, Deccan Healthcar, Bandaram Pharma, and others. Galaxy Medicare has the highest 1-year return at 0.00%, while Bandaram Pharma has the lowest at -41.87%, with Chennai Meena's return at -1.32%.

Peers: The peers of Chennai Meena are GKB Ophthalmics, Deccan Healthcar, Bandaram Pharma, Tejnaksh Health., Adeshwar Meditex, Samsrita Labs, Transgene Biotek, Vanta Bioscience, and Galaxy Medicare.<BR><BR>Quality Snapshot: Below Average management risk is observed at GKB Ophthalmics, Deccan Healthcar, Bandaram Pharma, Adeshwar Meditex, Vanta Bioscience, and the rest. Below Average growth is noted at Adeshwar Meditex, Tejnaksh Health., Vanta Bioscience, and the rest, while Excellent growth is found at Bandaram Pharma. Good capital structure is seen at GKB Ophthalmics, Deccan Healthcar, and the rest, while Average capital structure is present at Adeshwar Meditex, and Below Average at Bandaram Pharma, Vanta Bioscience, and the rest.<BR><BR>Return Snapshot: The peer with the highest 1-year return is Galaxy Medicare at 0.00%, while Bandaram Pharma has the lowest at -41.87%. Chennai Meena's 1-year return is -1.32%, which is better than Bandaram Pharma's but worse than Galaxy Medicare's. Additionally, peers with negative six-month returns include Deccan Healthcar, Bandaram Pharma, Samsrita Labs, and Vanta Bioscience.

View full answer

How big is Chennai Meena?

01-Sep-2026

As of 31st August, Chennai Meenakshi Multispeciality Hospital Ltd has a market capitalization of 29.00 Cr and reported net sales of 36.98 Cr with a net loss of 0.41 Cr over the latest four quarters.

As of 31st August, Chennai Meenakshi Multispeciality Hospital Ltd has a market capitalization of 29.00 Cr, categorizing it as a Micro Cap company.<BR><BR>In the latest four quarters, the company reported net sales of 36.98 Cr. However, it experienced a net loss of 0.41 Cr during the same period.<BR><BR>The latest annual reporting period for the balance sheet is March 2025. Shareholder's funds stood at a loss of 1.89 Cr, while total assets were valued at 22.51 Cr.

View full answer

Should I buy, sell or hold Chennai Meenakshi Multispeciality Hospital Ltd?

12-Aug-2026

When is the next results date for Chennai Meenakshi Multispeciality Hospital Ltd?

07-Aug-2026

The next results date for Chennai Meenakshi Multispeciality Hospital Ltd is August 11, 2026.

The next results date for Chennai Meenakshi Multispeciality Hospital Ltd is scheduled for August 11, 2026.

View full answer

Are Chennai Meenakshi Multispeciality Hospital Ltd latest results good or bad?

26-May-2026

Chennai Meenakshi Multispeciality Hospital Ltd's latest results are concerning, showing a net loss of ₹0.02 crore in Q4 FY26 despite a 6.98% revenue increase, marking the second consecutive quarterly loss and highlighting ongoing operational challenges and a negative net worth.

Chennai Meenakshi Multispeciality Hospital Ltd's latest results indicate a challenging financial situation. In Q4 FY26, the company reported a net loss of ₹0.02 crore, a significant decline from a profit of ₹0.31 crore in the same quarter last year. While revenue increased by 6.98% year-on-year to ₹9.81 crore, this growth did not translate into profitability, marking the second consecutive quarterly loss for the company.<BR><BR>The operating margin also contracted to 2.55%, down 127 basis points from the previous year, highlighting ongoing operational challenges. Additionally, the company has a negative net worth, with a book value per share of negative ₹2.53, raising serious concerns about its financial stability and ability to invest in necessary improvements.<BR><BR>Overall, the results reflect a company struggling with fundamental operational issues, and the volatility in profitability raises questions about the sustainability of its business model.

View full answer

How has been the historical performance of Chennai Meena?

14-Nov-2025

Chennai Meena's historical performance shows declining net sales and profits, with revenue dropping from 38.74 Cr in Mar'23 to 34.82 Cr in Mar'25, and a shift from profit to loss in operating profit and net profit. Despite these challenges, total liabilities and cash flow from operations remained stable.

Answer:<BR>The historical performance of Chennai Meena shows a fluctuating trend in its financial metrics over the years.<BR><BR>Breakdown:<BR>Chennai Meena's net sales decreased from 38.74 Cr in Mar'23 to 34.82 Cr in Mar'25, reflecting a decline in revenue. The total operating income followed a similar trend, dropping from 38.74 Cr in Mar'23 to 34.82 Cr in Mar'25. The company experienced an operating profit (PBDIT) decline, moving from 3.35 Cr in Mar'23 to a loss of 0.21 Cr in Mar'25. Consequently, the profit before tax also fell from 1.28 Cr in Mar'23 to a loss of 1.43 Cr in Mar'25, leading to a profit after tax decline from 0.89 Cr to a loss of 1.37 Cr in the same period. The company's total liabilities remained relatively stable, with a slight decrease from 22.81 Cr in Mar'24 to 22.51 Cr in Mar'25. Cash flow from operating activities remained consistent at 2.00 Cr from Mar'22 to Mar'25, while the closing cash and cash equivalents were stable at 2.00 Cr in Mar'25. Overall, Chennai Meena's financial performance indicates challenges in profitability despite stable cash flow and liabilities.

View full answer

Who are the top shareholders of the Chennai Meena?

17-Jul-2025

The top shareholders of Chennai Meena are Jayanthi Radhakrishnan with 25.59%, followed by public shareholder Vijayan Abinaya at 10.06%. Individual investors own 60.51%, with no pledged promoter holdings or foreign institutional investors.

The top shareholders of Chennai Meena include Jayanthi Radhakrishnan, who holds the highest stake at 25.59%. The highest public shareholder is Vijayan Abinaya, with a holding of 10.06%. Additionally, individual investors collectively own 60.51% of the company. There are no pledged promoter holdings or foreign institutional investors involved, and mutual funds hold a small percentage through one scheme at 0.14%.

View full answer

Is Chennai Meena overvalued or undervalued?

09-Jun-2025

As of May 31, 2024, Chennai Meena's valuation has shifted from attractive to risky due to negative financial metrics, including a PE ratio of -17.17 and an EV to EBITDA of -30.42, indicating it is overvalued and underperforming compared to peers like Max Healthcare and Apollo Hospitals, as well as the Sensex.

As of 31 May 2024, the valuation grade for Chennai Meena has moved from attractive to risky, indicating a significant deterioration in its financial health. The company appears to be overvalued based on its current metrics, with a PE ratio of -17.17, an EV to EBITDA of -30.42, and a ROCE of -11.43%. These negative ratios suggest that the company is struggling to generate profits and manage its capital effectively.<BR><BR>In comparison to its peers, Chennai Meena's valuation stands out unfavorably. For instance, Max Healthcare has a PE ratio of 100.29, while Apollo Hospitals shows a PE of 69.03, both indicating a much stronger market position. The stark contrast in valuation ratios highlights that Chennai Meena is not only underperforming but also facing significant challenges relative to its competitors. Additionally, the company's stock has underperformed the Sensex over the past year, with a return of -8.52% compared to the Sensex's 7.58%, reinforcing the notion that it is currently overvalued.

View full answer

What is the technical trend for Chennai Meena?

09-Jun-2025

As of May 12, 2025, Chennai Meena's technical trend is mildly bearish, influenced by bearish moving averages and Bollinger Bands, despite some mildly bullish signals in the weekly MACD and KST.

As of 12 May 2025, the technical trend for Chennai Meena has changed from bearish to mildly bearish. The weekly MACD indicates a mildly bullish stance, while the monthly MACD shows a mildly bearish trend. The Bollinger Bands are bearish on both weekly and monthly time frames, and daily moving averages are bearish. The KST reflects a mildly bullish weekly trend but is mildly bearish monthly. The Dow Theory shows a mildly bullish weekly trend with no trend on the monthly. Overall, the current technical stance is mildly bearish, influenced primarily by the bearish moving averages and Bollinger Bands, despite some mildly bullish signals in the MACD and KST on the weekly chart.

View full answer

Has Chennai Meena declared dividend?

06-Jun-2025

No Dividend History Available

iScoreScore

Dashboard

1

With a Negative Book Value, the company has a Weak Long Term Fundamental Strength

  • Poor long term growth as Net Sales has grown by an annual rate of 5.90% and Operating profit at 0% over the last 5 years
  • The company has a negative book value of Rs 3.07 crore
2

Flat results in Jun 26

3

Risky - Negative Operating Profits

4

Underperformed the market in the last 1 year

stock-summaryMojo Parameters

Mojo Parameters

Loading Valuation Snapshot...

Stock DNA

stock-summary
Industry

Healthcare Services

stock-summary
Market cap

INR 29 Cr (Micro Cap)

stock-summary
P/E

NA (Loss Making)

stock-summary
Industry P/E

68

stock-summary
Dividend Yield

0.00%

stock-summary
Debt Equity

-1.76

stock-summary
Return on Equity

13.36%

stock-summary
Price to Book

-9.46

Revenue and Profits:
Net Sales:
9 Cr
(Quarterly Results - Jun 2026)
Net Profit:
stock-summaryTotal Returns
Total Returns (Price + Dividend) stock-summary
Dividend Yield (0%)
TimePeriod
Price Return
Dividend Return
Total Return
3 Months
-8.0%
0%
-8.0%
6 Months
14.58%
0%
14.58%
1 Year
-15.59%
0%
-15.59%
2 Years
-8.16%
0%
-8.16%
3 Years
37.54%
0%
37.54%
4 Years
75.05%
0%
75.05%
5 Years
35.12%
0%
35.12%

Chennai Meena for the last several years.

Risk Adjusted Returns v/s stock-summary
Returns Beta
Icon
Beta has not been calculated since enough price history is not available
stock-summaryNews & Corporate Actions

Announcements stock-summary

Announcement under Regulation 30 (LODR)-Newspaper Publication

22-Sep-2026 | Source : BSE

Pursuant to Regulation 30 read with Schedule III Part A Para A of the SEBI (LODR) Regulations 2015 as amended from time to time and in accordance with the SEBI Circular HO/38/13/11(2)2026-MIRSD-POD/1/3750/2026 dated 30th January 2026 we hereby enclose the copies of the newspaper advertisement published for the Equity Shareholders of the Company regarding the Special Window for Transfer and Dematerialisation of Physical Securities.

Announcement under Regulation 30 (LODR)-Newspaper Publication

09-Sep-2026 | Source : BSE

Pursuant to reg 30 & 47 of SEBI(LODR) 2015 please find enclosed newspaper advertisement copies published on September 8 2026 in Financial Express (English) and Makkal Kural (Tamil). The notice cover the 36th AGM via VC/OAVM on September 30 2026 dispatch of the FY 25-26 Annual Report remote e-voting details and book closure from 24 Sept to 30 Sept 2026. Copies are also available at www.cmmh..in/# investors.

Intimation Under Regulation 30 And Regulation 36 Of SEBI (Listing Obligations And Disclosure Requirements) Regulations 2015 - Notice Of 36Th Annual General Meeting

08-Sep-2026 | Source : BSE

Pursuant to Reg 30 and 36 of SEBI (LODR) 2015 notice is hereby given that the 36th Annual General Meeting (AGM) of Chennai Meenakshi Multispeciality Hospital Limited is scheduled for Wednesday September 30 2026 at 11.00AM (IST) via Video Conferencing (VC)/ Other Audio- Visual Means (OAVM) in compliance with MCA and SEBI circulars. The Notice is dispatched electronically to members registered with the Company or Depositories (CDSL & NSDL). The cut off date to determine voting eligibility is Wednesday September 23 2026. The remote e-voting window opens on Sunday September 27 2026 at 9.00AM (IST) and closes on Tuesday September 29 2026 at 5.00PM (IST) via Central Depository Services (India) Limited (CDSL). The complete Notice is also available on the Companys website at www.cmmh.in/#investors . Kindly take the above information and the enclosed Notice on record.

Corporate Actions stock-summary

stock-summary
BOARD MEETING

No Upcoming Board Meetings

stock-summary
DIVIDEND

No Dividend history available

stock-summary
SPLITS

No Splits history available

stock-summary
BONUS

No Bonus history available

stock-summary
RIGHTS

No Rights history available

stock-summaryKey Factors

Quality key factors stock-summary

Factor
Value
Sales Growth (5y)
5.90%
EBIT Growth (5y)
-164.27%
EBIT to Interest (avg)
0
Debt to EBITDA (avg)
0.25
Net Debt to Equity (avg)
-1.76
Sales to Capital Employed (avg)
0
Tax Ratio
Tax Ratio is Negative%
Dividend Payout Ratio
0
Pledged Shares
0
Institutional Holding
0.14%
ROCE (avg)
7.95%
ROE (avg)
0

Valuation key factors

Factor
Value
P/E Ratio
NA (Loss Making)
Industry P/E
68
Price to Book Value
-9.37
EV to EBIT
-34.15
EV to EBITDA
34.15
EV to Capital Employed
14.72
EV to Sales
0.92
PEG Ratio
NA
Dividend Yield
NA
ROCE (Latest)
-59.91%
ROE (Latest)
Negative BV

Technicals key factors

Indicator
Weekly
Monthly
MACD
Mildly Bullish
Mildly Bearish
RSI
No Signal
No Signal
Bollinger Bands
Sideways
Bullish
Moving Averages
Mildly Bearish (Daily)
KST
Bearish
Mildly Bearish
Dow Theory
No Trend
Mildly Bearish
stock-summary Technical Indicator Scale: Bearish, Mildly Bearish, Sideways, Mildly Bullish, Bullish  Turned 
stock-summaryShareholding
Shareholding Snapshot : Jun 2026stock-summary
Shareholding Compare (%holding) stock-summary
Majority shareholders

Promoters

Pledged Promoter Holdings

None

Mutual Funds

Held by 1 Schemes (0.14%)

FIIs

Held by 0 FIIs

Promoter with highest holding

Jayanthi Radhakrishnan (25.59%)

Highest Public shareholder

Mahendra Girdharilal Wadhwani (2.65%)

Individual Investors Holdings

39.83%

stock-summaryFinancial
[
  {
    "link": "quarterly",
    "btn_text": "All Quarterly Results",
    "header": "Quarterly Results Snapshot (Standalone) - Jun'26 - QoQ",
    "rhs": [
      {
        "prefix": "Net Sales ",
        "suffix": "QoQ Growth in quarter ended Jun 2026 is -12.44% vs 7.68% in Mar 2026",
        "dir": -1
      },
      {
        "prefix": "Standalone Net Profit ",
        "suffix": "QoQ Growth in quarter ended Jun 2026 is 100.00% vs 96.30% in Mar 2026",
        "dir": 1
      }
    ],
    "table": {
      "header": [
        "Jun'26",
        "Mar'26",
        "Change(%)"
      ],
      "body": [
        {
          "field": "Net Sales",
          "val1": "8.59",
          "val2": "9.81",
          "chgp": "-12.44%",
          "chgp_class": "negative"
        },
        {
          "field": "Operating Profit (PBDIT) excl Other Income",
          "val1": "0.34",
          "val2": "0.25",
          "chgp": "36.00%",
          "chgp_class": "positive"
        },
        {
          "field": "Interest",
          "val1": "0.22",
          "val2": "0.23",
          "chgp": "-4.35%",
          "chgp_class": "positive"
        },
        {
          "field": "Exceptional Items",
          "val1": "0.00",
          "val2": "0.00",
          "chgp": "",
          "chgp_class": "neutral"
        },
        {
          "field": "Standalone Net Profit",
          "val1": "0.00",
          "val2": "-0.02",
          "chgp": "100.00%",
          "chgp_class": "positive"
        },
        {
          "field": "Operating Profit Margin (Excl OI)",
          "val1": "3.96%",
          "val2": "2.55%",
          "chgp": "1.41%",
          "chgp_class": "positive"
        }
      ]
    }
  },
  {
    "link": "half-yearly",
    "btn_text": "All Half Yearly Results",
    "header": "Half Yearly Results Snapshot (Standalone) - Sep'25",
    "rhs": [
      {
        "prefix": "Net Sales ",
        "suffix": " Growth in half year ended Sep 2025 is 7.73% vs -9.52% in Sep 2024",
        "dir": 1
      },
      {
        "prefix": "Standalone Net Profit ",
        "suffix": " Growth in half year ended Sep 2025 is 44.34% vs -1,866.67% in Sep 2024",
        "dir": 1
      }
    ],
    "table": {
      "header": [
        "Sep'25",
        "Sep'24",
        "Change(%)"
      ],
      "body": [
        {
          "field": "Net Sales",
          "val1": "18.12",
          "val2": "16.82",
          "chgp": "7.73%",
          "chgp_class": "positive"
        },
        {
          "field": "Operating Profit (PBDIT) excl Other Income",
          "val1": "-0.22",
          "val2": "-0.17",
          "chgp": "-29.41%",
          "chgp_class": "negative"
        },
        {
          "field": "Interest",
          "val1": "0.45",
          "val2": "0.46",
          "chgp": "-2.17%",
          "chgp_class": "positive"
        },
        {
          "field": "Exceptional Items",
          "val1": "0.00",
          "val2": "0.00",
          "chgp": "",
          "chgp_class": "neutral"
        },
        {
          "field": "Standalone Net Profit",
          "val1": "-0.59",
          "val2": "-1.06",
          "chgp": "44.34%",
          "chgp_class": "positive"
        },
        {
          "field": "Operating Profit Margin (Excl OI)",
          "val1": "-1.21%",
          "val2": "-1.01%",
          "chgp": "-0.20%",
          "chgp_class": "negative"
        }
      ]
    }
  },
  {
    "link": "nine-monthly",
    "btn_text": "All Nine Monthly Results",
    "header": "Nine Monthly Results Snapshot (Standalone) - Dec'25",
    "rhs": [
      {
        "prefix": "Net Sales ",
        "suffix": "YoY Growth in nine months ended Dec 2025 is 6.16% vs -10.50% in Dec 2024",
        "dir": 1
      },
      {
        "prefix": "Standalone Net Profit ",
        "suffix": "YoY Growth in nine months ended Dec 2025 is 33.14% vs -8,550.00% in Dec 2024",
        "dir": 1
      }
    ],
    "table": {
      "header": [
        "Dec'25",
        "Dec'24",
        "Change(%)"
      ],
      "body": [
        {
          "field": "Net Sales",
          "val1": "27.23",
          "val2": "25.65",
          "chgp": "6.16%",
          "chgp_class": "positive"
        },
        {
          "field": "Operating Profit (PBDIT) excl Other Income",
          "val1": "-0.55",
          "val2": "-0.55",
          "chgp": "",
          "chgp_class": "neutral"
        },
        {
          "field": "Interest",
          "val1": "0.67",
          "val2": "0.69",
          "chgp": "-2.90%",
          "chgp_class": "positive"
        },
        {
          "field": "Exceptional Items",
          "val1": "0.00",
          "val2": "0.00",
          "chgp": "",
          "chgp_class": "neutral"
        },
        {
          "field": "Standalone Net Profit",
          "val1": "-1.13",
          "val2": "-1.69",
          "chgp": "33.14%",
          "chgp_class": "positive"
        },
        {
          "field": "Operating Profit Margin (Excl OI)",
          "val1": "-2.02%",
          "val2": "-2.14%",
          "chgp": "0.12%",
          "chgp_class": "positive"
        }
      ]
    }
  },
  {
    "link": "annual",
    "btn_text": "All Annual Results",
    "header": "Annual Results Snapshot (Standalone) - Mar'26",
    "rhs": [
      {
        "prefix": "Net Sales ",
        "suffix": "YoY Growth in year ended Mar 2026 is 6.38% vs -8.85% in Mar 2025",
        "dir": 1
      },
      {
        "prefix": "Standalone Net Profit ",
        "suffix": "YoY Growth in year ended Mar 2026 is 18.25% vs -218.60% in Mar 2025",
        "dir": 1
      }
    ],
    "table": {
      "header": [
        "Mar'26",
        "Mar'25",
        "Change(%)"
      ],
      "body": [
        {
          "field": "Net Sales",
          "val1": "37.04",
          "val2": "34.82",
          "chgp": "6.38%",
          "chgp_class": "positive"
        },
        {
          "field": "Operating Profit (PBDIT) excl Other Income",
          "val1": "-0.28",
          "val2": "-0.21",
          "chgp": "-33.33%",
          "chgp_class": "negative"
        },
        {
          "field": "Interest",
          "val1": "0.90",
          "val2": "0.91",
          "chgp": "-1.10%",
          "chgp_class": "positive"
        },
        {
          "field": "Exceptional Items",
          "val1": "0.00",
          "val2": "0.00",
          "chgp": "",
          "chgp_class": "neutral"
        },
        {
          "field": "Standalone Net Profit",
          "val1": "-1.12",
          "val2": "-1.37",
          "chgp": "18.25%",
          "chgp_class": "positive"
        },
        {
          "field": "Operating Profit Margin (Excl OI)",
          "val1": "-0.76%",
          "val2": "-0.60%",
          "chgp": "-0.16%",
          "chgp_class": "negative"
        }
      ]
    }
  }
]

Quarterly Results Snapshot (Standalone) - Jun'26 - QoQstock-summary

Jun'26
Mar'26
Change(%)
Net Sales
8.59
9.81
-12.44%
Operating Profit (PBDIT) excl Other Income
0.34
0.25
36.00%
Interest
0.22
0.23
-4.35%
Exceptional Items
0.00
0.00
Standalone Net Profit
0.00
-0.02
100.00%
Operating Profit Margin (Excl OI)
3.96%
2.55%
1.41%
Values in Rs Cr.
Direction Arrows
Net Sales

QoQ Growth in quarter ended Jun 2026 is -12.44% vs 7.68% in Mar 2026

Direction Arrows
Standalone Net Profit

QoQ Growth in quarter ended Jun 2026 is 100.00% vs 96.30% in Mar 2026

Half Yearly Results Snapshot (Standalone) - Sep'25stock-summary

Sep'25
Sep'24
Change(%)
Net Sales
18.12
16.82
7.73%
Operating Profit (PBDIT) excl Other Income
-0.22
-0.17
-29.41%
Interest
0.45
0.46
-2.17%
Exceptional Items
0.00
0.00
Standalone Net Profit
-0.59
-1.06
44.34%
Operating Profit Margin (Excl OI)
-1.21%
-1.01%
-0.20%
Values in Rs Cr.
Direction Arrows
Net Sales

Growth in half year ended Sep 2025 is 7.73% vs -9.52% in Sep 2024

Direction Arrows
Standalone Net Profit

Growth in half year ended Sep 2025 is 44.34% vs -1,866.67% in Sep 2024

Nine Monthly Results Snapshot (Standalone) - Dec'25stock-summary

Dec'25
Dec'24
Change(%)
Net Sales
27.23
25.65
6.16%
Operating Profit (PBDIT) excl Other Income
-0.55
-0.55
Interest
0.67
0.69
-2.90%
Exceptional Items
0.00
0.00
Standalone Net Profit
-1.13
-1.69
33.14%
Operating Profit Margin (Excl OI)
-2.02%
-2.14%
0.12%
Values in Rs Cr.
Direction Arrows
Net Sales

YoY Growth in nine months ended Dec 2025 is 6.16% vs -10.50% in Dec 2024

Direction Arrows
Standalone Net Profit

YoY Growth in nine months ended Dec 2025 is 33.14% vs -8,550.00% in Dec 2024

Annual Results Snapshot (Standalone) - Mar'26stock-summary

Mar'26
Mar'25
Change(%)
Net Sales
37.04
34.82
6.38%
Operating Profit (PBDIT) excl Other Income
-0.28
-0.21
-33.33%
Interest
0.90
0.91
-1.10%
Exceptional Items
0.00
0.00
Standalone Net Profit
-1.12
-1.37
18.25%
Operating Profit Margin (Excl OI)
-0.76%
-0.60%
-0.16%
Values in Rs Cr.
Direction Arrows
Net Sales

YoY Growth in year ended Mar 2026 is 6.38% vs -8.85% in Mar 2025

Direction Arrows
Standalone Net Profit

YoY Growth in year ended Mar 2026 is 18.25% vs -218.60% in Mar 2025

stock-summaryCompany CV
About Chennai Meenakshi Multispeciality Hospital Ltd stock-summary
stock-summary
Chennai Meenakshi Multispeciality Hospital Ltd
Micro Cap
Healthcare Services
Chennai Meenakshi Multispeciality Hospital Limited, formerly known as Devaki Hospital Limited, was incorporated in 1990. The Company name was changed from Devaki Hospital Limited to Chennai Meenakshi Multispeciality Hospital Limited in October, 2007. It is a 100-bedded hospital located in the heart of Chennai at Mylapore. The hospital has an infrastructure comprising of around 105 Beds including ICU Beds, Operating Theatre, a modern dialysis Unit besides a host of other facilities.
Company Coordinates stock-summary
Company Details
New No 70 Old No 149, Luz Church Road Mylapore Chennai Tamil Nadu : 600004
stock-summary
Tel: 91-044-42938938
stock-summary
cmmhospitals@gmail.com
Registrar Details
Cameo Corporate Services Ltd , Subramanian Buildings No 1 , Club House Road, Chennai
Footer loading