
Compare C P C L with Similar Stocks
Dashboard
Strong Long Term Fundamental Strength with an average Return on Equity (ROE) of 32.29%
- Healthy long term growth as Net Sales has grown by an annual rate of 23.23% and Operating profit at 22.64%
- Company's ability to service its debt is strong with a healthy EBIT to Interest (avg) ratio of 14.89
With a growth in Net Profit of 41.78%, the company declared Very Positive results in Mar 26
With ROE of 27.9, it has a Very Attractive valuation with a 1.5 Price to Book Value
Increasing Participation by Institutional Investors
Total Returns (Price + Dividend) 
Latest dividend: 8 per share ex-dividend date: Apr-02-2026
Risk Adjusted Returns v/s
Returns Beta

News

Broad-Based Technical Strength Lifts Chennai Petroleum Corporation Ltd to 52-Week High of Rs 1242.85
Surging past its previous highs, Chennai Petroleum Corporation Ltd touched a fresh 52-week peak of Rs 1242.85 on 10 Jun 2026, marking a remarkable 82.37% gain over the past year. This milestone comes amid a backdrop of strong technical momentum and sustained upward price action, even as the broader Sensex trades below its 50-day moving average.
Read full news article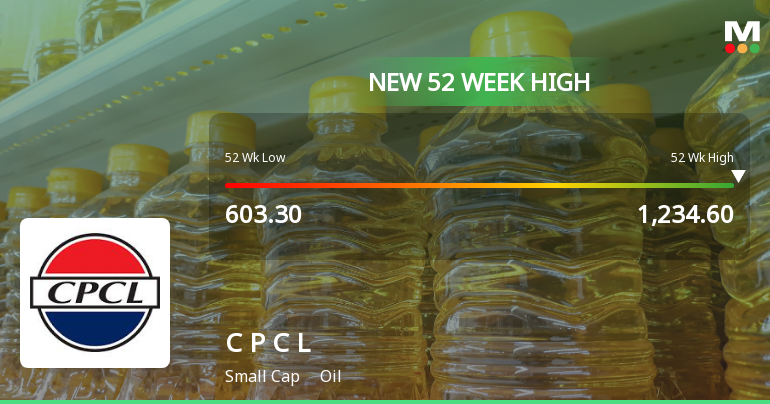
Broad-Based Technical Strength Lifts Chennai Petroleum Corporation Ltd to 52-Week High of Rs 1234.6
With a remarkable surge to Rs 1234.6 on 09 Jun 2026, Chennai Petroleum Corporation Ltd has reached a fresh 52-week high, marking an 88.8% rally over the past year. This milestone comes amid a backdrop of strong technical momentum and sustained upward price action, setting the stock apart in a market where the Sensex has struggled to maintain its footing.
Read full news article
Chennai Petroleum Corporation Ltd is Rated Strong Buy
Chennai Petroleum Corporation Ltd is rated 'Strong Buy' by MarketsMOJO, with this rating last updated on 24 February 2026. However, the analysis and financial metrics discussed here reflect the company’s current position as of 08 June 2026, providing investors with the latest insights into its performance and outlook.
Read full news article Announcements
Compliances-Reg.24(A)-Annual Secretarial Compliance
29-May-2026 | Source : BSEAnnual Secretarial Compliance Report for the year ended 31.03.2026
Announcement under Regulation 30 (LODR)-Analyst / Investor Meet - Outcome
28-Apr-2026 | Source : BSETranscripts of Post Results Conference Call - Q4 (FY 2025-26) held on 24.04.2026
Announcement under Regulation 30 (LODR)-Newspaper Publication
26-Apr-2026 | Source : BSENewspaper Clippings - Publication of Financial Results for the Quarter and Year ended 31.03.2026
Corporate Actions

No Upcoming Board Meetings

Chennai Petroleum Corporation Ltd has declared 80% dividend, ex-date: 02 Apr 26

No Splits history available

No Bonus history available

No Rights history available
Quality key factors
Valuation key factors
Technicals key factors
 Technical Indicator Scale: Bearish, Mildly Bearish, Sideways, Mildly Bullish, Bullish Turned
 Shareholding Snapshot : Mar 2026
Shareholding Compare (%holding)
Promoters
None
Held by 24 Schemes (1.58%)
Held by 197 FIIs (12.59%)
Indian Oil Corporation Limited (51.89%)
Dolly Khanna (1.3%)
14.72%
Quarterly Results Snapshot (Consolidated) - Mar'26 - QoQ

QoQ Growth in quarter ended Mar 2026 is 7.23% vs -3.95% in Dec 2025
QoQ Growth in quarter ended Mar 2026 is 41.96% vs 39.27% in Dec 2025
Half Yearly Results Snapshot (Consolidated) - Sep'25
Growth in half year ended Sep 2025 is 6.71% vs -6.74% in Sep 2024
Growth in half year ended Sep 2025 is 345.57% vs -115.79% in Sep 2024
Nine Monthly Results Snapshot (Consolidated) - Dec'25
YoY Growth in nine months ended Dec 2025 is 11.20% vs -13.48% in Dec 2024
YoY Growth in nine months ended Dec 2025 is 757.02% vs -112.08% in Dec 2024
Annual Results Snapshot (Consolidated) - Mar'26
YoY Growth in year ended Mar 2026 is 7.22% vs -10.59% in Mar 2025
YoY Growth in year ended Mar 2026 is 1,349.25% vs -92.20% in Mar 2025
About Chennai Petroleum Corporation Ltd

Company Coordinates


