
Compare Cheviot Company with Similar Stocks
Dashboard
Poor long term growth as Net Sales has grown by an annual rate of 6.70% and Operating profit at 7.10% over the last 5 years
- PAT(Q) At Rs -9.05 cr has Fallen at -197.2%
- ROCE(HY) Lowest at 9.80%
- PBT LESS OI(Q) At Rs 15.13 cr has Fallen at -19.31%
Despite the size of the company, domestic mutual funds hold only 0.01% of the company
Consistent Underperformance against the benchmark over the last 3 years
Stock DNA
Paper, Forest & Jute Products
INR 630 Cr (Micro Cap)
12.00
23
0.46%
-0.03
7.32%
0.90
Total Returns (Price + Dividend) 
Latest dividend: 5 per share ex-dividend date: Jul-31-2025
Risk Adjusted Returns v/s
Returns Beta

News

Cheviot Company Ltd Downgraded to Sell Amid Valuation and Financial Concerns
Cheviot Company Ltd, a micro-cap player in the Paper, Forest & Jute Products sector, has seen its investment rating downgraded from Hold to Sell as of 10 June 2026. The downgrade reflects a reassessment across four key parameters: quality, valuation, financial trend, and technicals, with valuation concerns and deteriorating financial performance driving the change.
Read full news article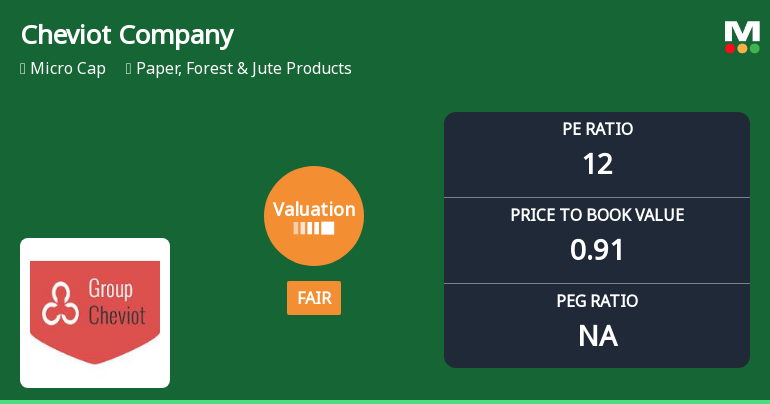
Cheviot Company Ltd Valuation Shifts to Fair Amidst Mixed Market Performance
Cheviot Company Ltd, a micro-cap player in the Paper, Forest & Jute Products sector, has experienced a notable shift in its valuation parameters, moving from an attractive to a fair rating. This change reflects evolving market perceptions amid sector dynamics and peer comparisons, with key metrics such as the price-to-earnings (P/E) and price-to-book value (P/BV) ratios signalling a recalibration of price attractiveness.
Read full news article
Golden Cross Confirmed: Do Cheviot Company Ltd's Other Technical Indicators Agree?
The 50-day moving average for Cheviot Company Ltd has crossed above the 200-day moving average, signalling a golden cross on 3 Jun 2026. While this technical event often suggests a shift towards bullish momentum, the stock's recent price decline of 2.53% on the day of the crossover and mixed monthly indicators complicate the narrative.
Read full news article Announcements
Announcement under Regulation 30 (LODR)-Date of payment of Dividend
21-May-2026 | Source : BSEDividend as recommended by the Board of Directors if declared at the ensuing AGM will be paid on and from 11th August 2026 subject to deduction of tax at source wherever applicable.
Record Date For Dividend
21-May-2026 | Source : BSERecord date for dividend fixed on Thursday 30th July 2026.
Board Meeting Outcome for Outcome Of Board Meeting Held On 21St May 2026
21-May-2026 | Source : BSEOutcome of Board Meeting held on 21st May 2026
Corporate Actions

No Upcoming Board Meetings

Cheviot Company Ltd has declared 250% dividend, ex-date: 30 Jul 26

No Splits history available

Cheviot Company Ltd has announced 1:2 bonus issue, ex-date: 29 Aug 18

No Rights history available
Quality key factors
Valuation key factors
Technicals key factors
 Technical Indicator Scale: Bearish, Mildly Bearish, Sideways, Mildly Bullish, Bullish Turned
 Shareholding Snapshot : Mar 2026
Shareholding Compare (%holding)
Promoters
None
Held by 1 Schemes (0.0%)
Held by 12 FIIs (0.28%)
Harsh Investments Private Limited (70.61%)
None
19.16%
Quarterly Results Snapshot (Standalone) - Mar'26 - YoY

YoY Growth in quarter ended Mar 2026 is 5.10% vs 8.91% in Mar 2025
YoY Growth in quarter ended Mar 2026 is -197.21% vs -37.64% in Mar 2025
Half Yearly Results Snapshot (Standalone) - Sep'25

Growth in half year ended Sep 2025 is 35.62% vs -18.21% in Sep 2024
Growth in half year ended Sep 2025 is -3.20% vs 23.13% in Sep 2024
Nine Monthly Results Snapshot (Standalone) - Dec'25
YoY Growth in nine months ended Dec 2025 is 33.10% vs -10.10% in Dec 2024
YoY Growth in nine months ended Dec 2025 is 25.44% vs -11.07% in Dec 2024
Annual Results Snapshot (Standalone) - Mar'26
YoY Growth in year ended Mar 2026 is 24.57% vs -5.05% in Mar 2025
YoY Growth in year ended Mar 2026 is -10.48% vs -16.79% in Mar 2025
About Cheviot Company Ltd

Company Coordinates


