
Compare Chewy, Inc. with Similar Stocks
Total Returns (Price + Dividend) 
Chewy, Inc. for the last several years.
Risk Adjusted Returns v/s
News

Chewy, Inc. Experiences Revision in Its Stock Evaluation Amid Mixed Valuation Metrics
Chewy, Inc. has recently adjusted its valuation, showcasing a high P/E ratio of 51 and elevated EV metrics. Compared to industry peers, its performance has been mixed, with a year-to-date return of -0.06%, contrasting with the S&P 500's growth, highlighting challenges in maintaining market position.
Read full news article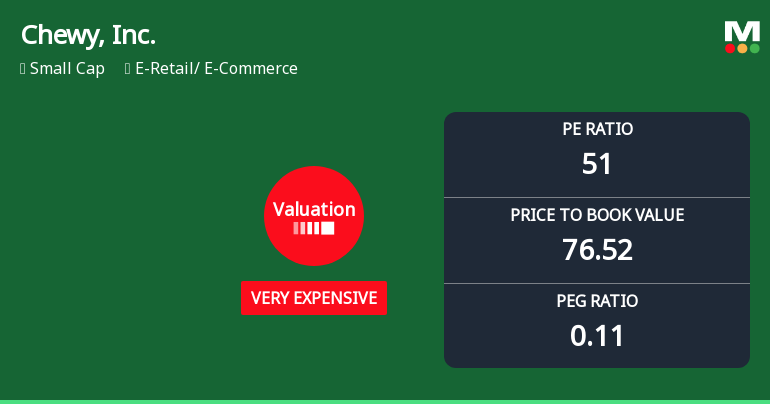
Chewy, Inc. Experiences Revision in Stock Evaluation Amidst High Valuation Metrics
Chewy, Inc. has recently adjusted its valuation, showcasing a high P/E ratio of 51 and an elevated price-to-book value of 76.52. Despite a low PEG ratio of 0.11 and a strong return on equity of 148.89%, the company faces challenges with negative capital employed, reflecting a complex market position.
Read full news article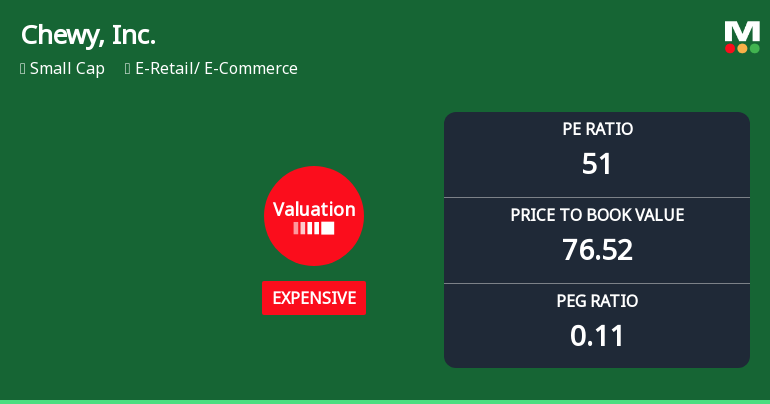
Chewy, Inc. Experiences Revision in Stock Evaluation Amidst Shifting Financial Metrics
Chewy, Inc. has recently adjusted its valuation, showcasing a high P/E ratio of 51 and a price-to-book value of 76.52. Despite a strong return on equity at 148.89%, the company faces challenges with negative capital employed. Its valuation metrics contrast sharply with peers in the E-Retail sector.
Read full news article Announcements

Corporate Actions
Quality key factors
Valuation key factors
Technicals key factors
 Technical Indicator Scale: Bearish, Mildly Bearish, Sideways, Mildly Bullish, Bullish Turned
 Shareholding Snapshot : Oct 2025
Shareholding Compare (%holding)
Domestic Funds
Held in 105 Schemes (41.49%)
Held by 237 Foreign Institutions (14.11%)
Quarterly Results Snapshot (Consolidated) - Oct'25 - YoY

YoY Growth in quarter ended Oct 2025 is 8.31% vs 5.08% in Oct 2024
YoY Growth in quarter ended Oct 2025 is 1,417.95% vs 110.89% in Oct 2024
Annual Results Snapshot (Consolidated) - Jan'25

YoY Growth in year ended Jan 2025 is 6.40% vs 10.17% in Jan 2024
YoY Growth in year ended Jan 2025 is 891.67% vs -20.64% in Jan 2024
About Chewy, Inc.

Company Coordinates


