
Compare Choice Intl. with Similar Stocks
Dashboard
With ROE of 13, it has a Very Expensive valuation with a 9 Price to Book Value
- The stock is trading at a premium compared to its peers' average historical valuations
- Over the past year, while the stock has generated a return of -2.91%, its profits have risen by 39.1% ; the PEG ratio of the company is 2.8
Falling Participation by Institutional Investors
Stock DNA
Holding Company
INR 14,968 Cr (Small Cap)
69.00
20
0.00%
0.54
13.02%
8.76
Total Returns (Price + Dividend) 
Latest dividend: 1 per share ex-dividend date: Sep-09-2016
Risk Adjusted Returns v/s
Returns Beta

News

Choice International Ltd is Rated Sell
Choice International Ltd is rated Sell by MarketsMOJO. This rating was last updated on 02 Mar 2026, reflecting a reassessment of the stock’s outlook. However, the analysis and financial metrics discussed below are based on the company’s current position as of 10 June 2026, providing investors with the latest insights into its performance and valuation.
Read full news article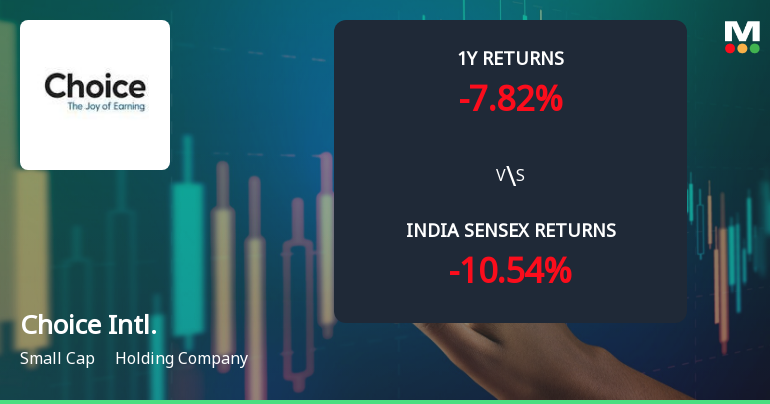
Choice International Ltd Faces Bearish Momentum Amid Technical Downgrade
Choice International Ltd, a small-cap holding company, has experienced a notable shift in its technical momentum, with key indicators signalling a bearish trend. The stock’s recent price action and technical parameters suggest increasing downside pressure, reflecting broader challenges in sustaining upward momentum amid a subdued market environment.
Read full news article
Choice International Ltd is Rated Sell by MarketsMOJO
Choice International Ltd is rated Sell by MarketsMOJO, with this rating last updated on 02 Mar 2026. However, the analysis and financial metrics discussed here reflect the stock’s current position as of 30 May 2026, providing investors with the latest insights into its performance and outlook.
Read full news article Announcements
Compliances-Reg.24(A)-Annual Secretarial Compliance
29-May-2026 | Source : BSEAnnual Secretarial Compliance Report for the Financial Year ended March 31 2026.
Announcement under Regulation 30 (LODR)-Acquisition
25-May-2026 | Source : BSEAcquisition of 100% stake in Ellora Solutions Private Limited by the Company.
Shareholder Meeting / Postal Ballot-Outcome of Postal_Ballot
12-May-2026 | Source : BSEOutcome of Postal Ballot Notice Dated April 10 2026.
Corporate Actions

No Upcoming Board Meetings

Choice International Ltd has declared 10% dividend, ex-date: 09 Sep 16

No Splits history available

Choice International Ltd has announced 1:1 bonus issue, ex-date: 20 Feb 24

Choice International Ltd has announced 1:4 rights issue, ex-date: 19 Jan 22
Quality key factors
Valuation key factors
Technicals key factors
 Technical Indicator Scale: Bearish, Mildly Bearish, Sideways, Mildly Bullish, Bullish Turned
 Shareholding Snapshot : Mar 2026
Shareholding Compare (%holding)
Promoters
11.8968
Held by 17 Schemes (0.29%)
Held by 87 FIIs (11.41%)
Vinita Sunil Patodia (11.13%)
Plutus Wealth Management Llp (8.66%)
19.53%
Quarterly Results Snapshot (Consolidated) - Mar'26 - QoQ

QoQ Growth in quarter ended Mar 2026 is 1.10% vs 10.54% in Dec 2025

QoQ Growth in quarter ended Mar 2026 is 5.57% vs 3.44% in Dec 2025
Half Yearly Results Snapshot (Consolidated) - Sep'25
Growth in half year ended Sep 2025 is 13.62% vs 36.24% in Sep 2024
Growth in half year ended Sep 2025 is 32.87% vs 47.42% in Sep 2024
Nine Monthly Results Snapshot (Standalone) - Mar'26
YoY Growth in nine months ended Mar 2026 is 4.74% vs 88.59% in Dec 2024
YoY Growth in nine months ended Mar 2026 is -38.12% vs 422.79% in Dec 2024
Annual Results Snapshot (Consolidated) - Mar'26
YoY Growth in year ended Mar 2026 is 22.93% vs 21.27% in Mar 2025
YoY Growth in year ended Mar 2026 is 39.04% vs 21.48% in Mar 2025
About Choice International Ltd

Company Coordinates


