
Compare Choksi Asia with Similar Stocks
Dashboard
Weak Long Term Fundamental Strength with an average Return on Equity (ROE) of 3.57%
- Company's ability to service its debt is weak with a poor EBIT to Interest (avg) ratio of 0.73
The company has declared Positive results for the last 8 consecutive quarters
With ROE of 12.6, it has a Very Attractive valuation with a 1.9 Price to Book Value
Majority shareholders : Promoters
Consistent Returns over the last 3 years
Total Returns (Price + Dividend) 
Latest dividend: 2.5 per share ex-dividend date: Sep-16-2021
Risk Adjusted Returns v/s
Returns Beta

News
Are Choksi Asia Ltd latest results good or bad?
Choksi Asia Ltd's latest financial results present a complex picture of operational performance and challenges. For the full year FY26, the company reported net sales of ₹49.31 crores, which reflects a notable growth of 36.97% compared to the previous fiscal year. Additionally, net profit for the year reached ₹5.30 crores, marking a significant increase of 76.67% from ₹3.00 crores in FY25. This indicates a substantial operational turnaround over the year. In the fourth quarter of FY26, Choksi Asia recorded net sales of ₹11.86 crores, showing a slight decline of 3.26% quarter-on-quarter from ₹12.26 crores in Q3 FY26. However, the year-on-year comparison indicates relative stability, with only a 2.39% decrease from ₹12.15 crores in Q4 FY25. The operating profit margin (excluding other income) improved to 16.95%, up from 14.60% in the previous quarter and significantly higher than the 10.21% margin in Q4 FY25...
Read full news article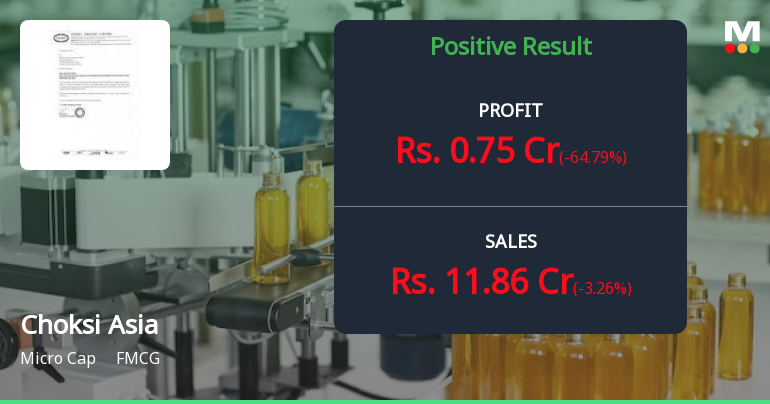
Choksi Asia Q4 FY26: Profit Plunge Amid Tax Anomaly Clouds Recovery Story
Choksi Asia Ltd., the micro-cap FMCG player specialising in photosensitised materials, reported a perplexing fourth quarter for FY26 with net profit plummeting 64.79% quarter-on-quarter to ₹0.75 crores despite maintaining steady operational performance. The sharp decline was driven entirely by an extraordinary tax charge of 65.12% in Q4 FY26, a stark contrast to the mere 1.39% tax rate in the preceding quarter, raising questions about the sustainability of the company's recent profitability momentum.
Read full news article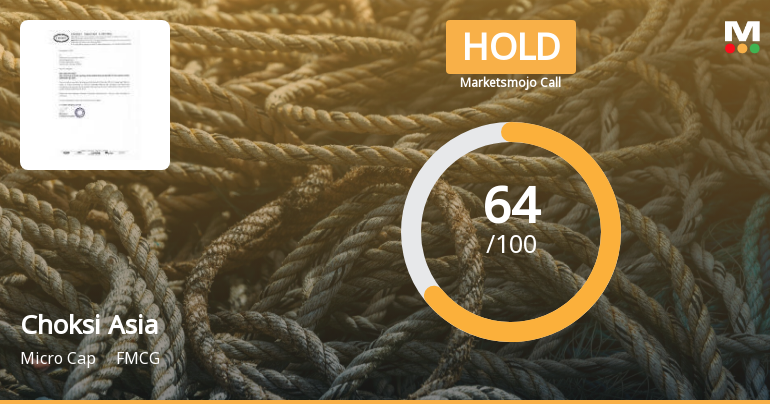
Choksi Asia Ltd is Rated Hold by MarketsMOJO
Choksi Asia Ltd is rated 'Hold' by MarketsMOJO, with this rating last updated on 04 May 2026. However, the analysis and financial metrics discussed here reflect the stock's current position as of 27 May 2026, providing investors with the most up-to-date view of the company’s performance and outlook.
Read full news article Announcements
General Update - Submission Of Newspaper Advertisement For Transfer Of Equity Share To IEPF.
05-Jun-2026 | Source : BSEGeneral Update - Submission of newspaper advertisement for transfer of equity shares to IEPF.
General Update - Submission Of Newspaper Advertisment Of Audited Financial Result For The Quarter And Year Ended March 31 2026.
30-May-2026 | Source : BSEGeneral Update - Submission of newspaper advertisment of Audited Financial Results for the quarter and year ended March 31 2026.
Results - Audited Financial Results For The Quarter And Year Ended March 31 2026.
29-May-2026 | Source : BSEResults - Audited Financial Results for the quarter and year ended March 31 2026.
Corporate Actions

No Upcoming Board Meetings

Choksi Asia Ltd has declared 25% dividend, ex-date: 16 Sep 21

No Splits history available

No Bonus history available

No Rights history available
Quality key factors
Valuation key factors
Technicals key factors
 Technical Indicator Scale: Bearish, Mildly Bearish, Sideways, Mildly Bullish, Bullish Turned
 Shareholding Snapshot : Mar 2026
Shareholding Compare (%holding)
Promoters
None
Held by 0 Schemes
Held by 0 FIIs
Samir Choksi (43.9%)
Yamini Choksi (3.01%)
22.35%
Quarterly Results Snapshot (Standalone) - Mar'26 - QoQ

QoQ Growth in quarter ended Mar 2026 is -3.26% vs -7.75% in Dec 2025

QoQ Growth in quarter ended Mar 2026 is -64.79% vs 57.78% in Dec 2025
Half Yearly Results Snapshot (Standalone) - Sep'25
Growth in half year ended Sep 2025 is 55.88% vs 1,656.52% in Sep 2024
Growth in half year ended Sep 2025 is 11.01% vs 536.00% in Sep 2024
Nine Monthly Results Snapshot (Standalone) - Dec'25
YoY Growth in nine months ended Dec 2025 is 50.83% vs 2,199.07% in Dec 2024
YoY Growth in nine months ended Dec 2025 is 89.58% vs 411.69% in Dec 2024
Annual Results Snapshot (Standalone) - Mar'26
YoY Growth in year ended Mar 2026 is 33.34% vs 131.27% in Mar 2025
YoY Growth in year ended Mar 2026 is 71.94% vs 123.02% in Mar 2025
About Choksi Asia Ltd

Company Coordinates


