
Compare Chrome Silicon with Similar Stocks
Dashboard
With a Operating Losses, the company has a Weak Long Term Fundamental Strength
- Poor long term growth as Net Sales has grown by an annual rate of -9.58% over the last 5 years
- Low ability to service debt as the company has a high Debt to EBITDA ratio of -0.47 times
Flat results in Mar 26
Risky - Negative EBITDA
Stock DNA
Ferrous Metals
INR 64 Cr (Micro Cap)
NA (Loss Making)
13
0.00%
1.76
-49.47%
3.14
Total Returns (Price + Dividend) 
Latest dividend: 3 per share ex-dividend date: Sep-20-2012
Risk Adjusted Returns v/s
Returns Beta

News
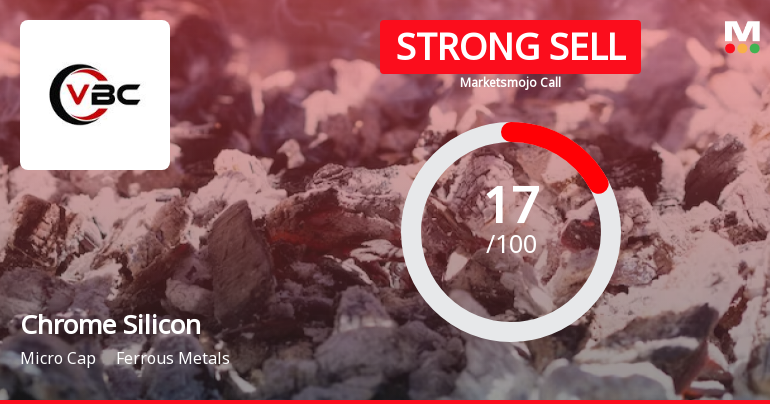
Chrome Silicon Ltd is Rated Strong Sell
Chrome Silicon Ltd is rated Strong Sell by MarketsMOJO. This rating was last updated on 25 May 2026, reflecting a shift from the previous 'Sell' grade. However, the analysis and financial metrics discussed here represent the stock's current position as of 17 June 2026, providing investors with the latest insights into the company’s performance and outlook.
Read full news articleAre Chrome Silicon Ltd latest results good or bad?
Chrome Silicon Ltd's latest financial results for Q4 FY26 reveal a company facing significant operational challenges. The company reported net sales of ₹0.00 crores, marking a complete cessation of revenue generation compared to ₹5.04 crores in the same quarter last year. This represents a dramatic decline and highlights the company's operational collapse, as it also recorded a net loss of ₹2.56 crores, widening from a loss of ₹2.13 crores in the previous quarter. The financial metrics indicate a severe deterioration in performance. The operating profit (PBDIT) excluding other income showed a loss of ₹1.12 crores, which, while an improvement from the previous year's loss, reflects the absence of operational activity rather than a recovery. The company's return on equity (ROE) stands at a deeply negative -412.57%, and the book value per share is reported at ₹-125.87, indicating a negative equity position. ...
Read full news article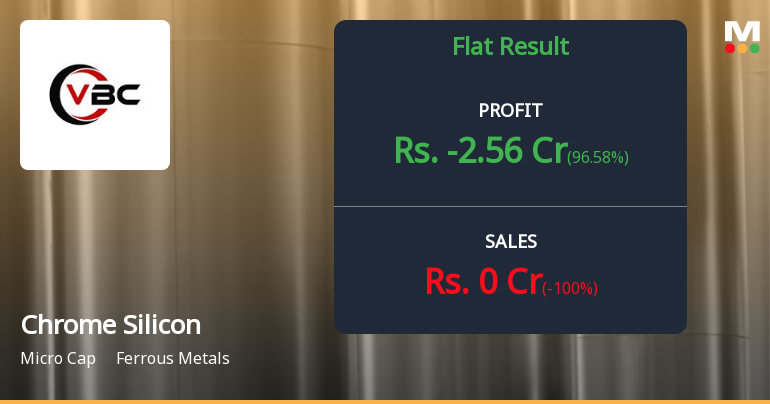
Chrome Silicon Q4 FY26: Operations Grind to Halt as Losses Mount
Chrome Silicon Ltd., a micro-cap ferro silicon manufacturer with a market capitalisation of ₹74.00 crores, reported a catastrophic fourth quarter for FY26, with operations grinding to a complete halt and losses deepening. In Q4 FY26, the company reported zero net sales compared to ₹5.04 crores in Q4 FY25, whilst net loss widened to ₹2.56 crores from ₹74.78 crores in the year-ago quarter. The stock, trading at ₹45.49 as of May 29, 2026, has gained 5.62% in recent trading, though this uptick appears disconnected from the company's deteriorating fundamentals.
Read full news article Announcements
Shareholder Meeting / Postal Ballot-Notice of Postal Ballot
17-Jun-2026 | Source : BSEWe are herewith attaching the Postal Ballot Notice dated 29.05.2026.
Compliances-Reg.24(A)-Annual Secretarial Compliance
30-May-2026 | Source : BSEM/s B S S Assocaites Company Secretaries in Practice issued Annual Complaince Certificate for the Financial Year ended 31.03.2026 as per Regulation 24A of the SEBI(LODR) Regulations 2015. Copy of the Certificate attached herewith.
Board Meeting Outcome for Outcome Of The Board Meeting Held On 29.05.2026
29-May-2026 | Source : BSEThe Board of Directors have approved the Audited Financial Results and also decided to initate postal ballot for sale of plant and machinery of company situated at Rudraram Village Telanagana
Corporate Actions

No Upcoming Board Meetings

Chrome Silicon Ltd has declared 30% dividend, ex-date: 20 Sep 12

No Splits history available

No Bonus history available

No Rights history available
Quality key factors
Valuation key factors
Technicals key factors
 Technical Indicator Scale: Bearish, Mildly Bearish, Sideways, Mildly Bullish, Bullish Turned
 Shareholding Snapshot : Mar 2026
Shareholding Compare (%holding)
Non Institution
12.9067
Held by 0 Schemes
Held by 0 FIIs
Mvvs Murthi (15.66%)
Frontline Enterprises Limited (5.49%)
13.92%
Quarterly Results Snapshot (Standalone) - Mar'26 - YoY

YoY Growth in quarter ended Mar 2026 is -100.00% vs -86.46% in Mar 2025

YoY Growth in quarter ended Mar 2026 is 96.58% vs -74,880.00% in Mar 2025
Half Yearly Results Snapshot (Standalone) - Sep'25
Growth in half year ended Sep 2025 is -98.85% vs 95.53% in Sep 2024
Growth in half year ended Sep 2025 is 40.94% vs -4,252.38% in Sep 2024
Nine Monthly Results Snapshot (Standalone) - Dec'25
YoY Growth in nine months ended Dec 2025 is -98.43% vs 29.99% in Dec 2024
YoY Growth in nine months ended Dec 2025 is 34.77% vs -3,700.00% in Dec 2024
Annual Results Snapshot (Standalone) - Mar'26
YoY Growth in year ended Mar 2026 is -98.54% vs -18.27% in Mar 2025
YoY Growth in year ended Mar 2026 is 88.55% vs -20,561.90% in Mar 2025
About Chrome Silicon Ltd

Company Coordinates


