
Compare Cil Securities with Similar Stocks
Stock DNA
Non Banking Financial Company (NBFC)
INR 19 Cr (Micro Cap)
11.00
21
0.00%
0.00
5.05%
0.57
Total Returns (Price + Dividend) 
Latest dividend: 0.5 per share ex-dividend date: Sep-20-2019
Risk Adjusted Returns v/s
Returns Beta

News
Are Cil Securities Ltd latest results good or bad?
CIL Securities Ltd's latest financial results for Q4 FY26 reflect significant operational challenges. The company reported a net profit of ₹0.11 crores, which represents a substantial decline of 78.43% compared to the previous quarter. Revenue also decreased by 16.02% to ₹1.73 crores, marking the fourth consecutive quarter of revenue contraction. This persistent decline in revenue indicates ongoing difficulties in the company's core operations, particularly in the broking and commodities trading segments. The operating margin for the quarter fell dramatically to 12.72%, down from 36.41% in the prior quarter, highlighting severe margin compression. This decline in profitability metrics is concerning, as it suggests that the company is facing both operational inefficiencies and pricing pressures that may be indicative of deeper structural issues within its business model. On a year-on-year basis, the result...
Read full news article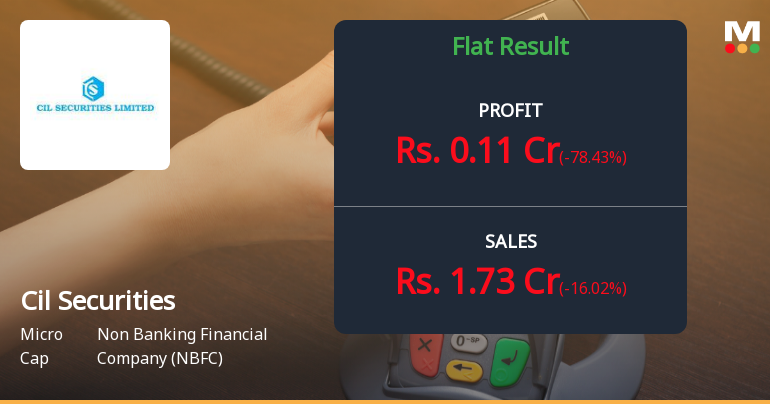
CIL Securities Q4 FY26: Profitability Plunges as Margins Collapse to Multi-Quarter Lows
CIL Securities Limited, a Hyderabad-based non-banking financial company (NBFC) specialising in stock broking and commodities trading, reported a sharp deterioration in profitability for Q4 FY26, with net profit plummeting 74.42% quarter-on-quarter to ₹0.11 crores from ₹0.51 crores in Q3 FY26. The micro-cap company, with a market capitalisation of ₹21 crores, saw its operating margins collapse to 12.72% from 36.41% in the previous quarter, marking the weakest quarterly performance in over two years.
Read full news article Announcements
Compliances-Certificate under Reg. 74 (5) of SEBI (DP) Regulations 2018
08-Jul-2026 | Source : BSEIn compliance with regulation 74(5) of SEBI(DP) Regulations 2018 we are herewith attching a copy of certificate received from our RTA division for the quarter ended 30th June 2026.
Closure of Trading Window
27-Jun-2026 | Source : BSEThis is to inform you that the trading window for dealing in securities of the company shall remain closed from 01st July 2026 in terms of provisions of SEBI(Prohibition of Insider Trading) Regulations 2015 as amended from time to time and in terms of companys code of conduct to regulate monitor and report trading by designated persons and their immediate relatives . The trading window shall remain closed until 48 hours after the declaration of Un-audited financial results for the quarter ended 30th june2026.
Compliances-Reg.24(A)-Annual Secretarial Compliance
18-May-2026 | Source : BSEPursuant to Regulation 24A of SEBI(LODR) Regulations2015 please find enclosed herewith annual secretarial compliance report for the financial year ended 31st March 2026.
Corporate Actions

No Upcoming Board Meetings

Cil Securities Ltd has declared 5% dividend, ex-date: 20 Sep 19

No Splits history available

No Bonus history available

No Rights history available
Quality key factors
Valuation key factors
Technicals key factors
 Technical Indicator Scale: Bearish, Mildly Bearish, Sideways, Mildly Bullish, Bullish Turned
 Shareholding Snapshot : Jun 2026
Shareholding Compare (%holding)
Promoters
None
Held by 0 Schemes
Held by 0 FIIs
Krishna Kumar Maheshwari (45.43%)
Highline Finance & Investments Private Limited (2.44%)
19.16%
Quarterly Results Snapshot (Standalone) - Mar'26 - QoQ

QoQ Growth in quarter ended Mar 2026 is -16.02% vs -7.21% in Dec 2025
QoQ Growth in quarter ended Mar 2026 is -78.43% vs -20.31% in Dec 2025
Half Yearly Results Snapshot (Standalone) - Sep'25
Growth in half year ended Sep 2025 is -15.68% vs 13.87% in Sep 2024
Growth in half year ended Sep 2025 is -9.48% vs 9.43% in Sep 2024
Nine Monthly Results Snapshot (Standalone) - Dec'25
YoY Growth in nine months ended Dec 2025 is -15.00% vs 3.17% in Dec 2024

YoY Growth in nine months ended Dec 2025 is -4.88% vs -15.03% in Dec 2024
Annual Results Snapshot (Standalone) - Mar'26
YoY Growth in year ended Mar 2026 is -14.95% vs -6.65% in Mar 2025
YoY Growth in year ended Mar 2026 is -18.93% vs -28.47% in Mar 2025
About Cil Securities Ltd

Company Coordinates


