
Compare City Online Ser. with Similar Stocks
Dashboard
With a Negative Book Value, the company has a Weak Long Term Fundamental Strength
- Poor long term growth as Net Sales has grown by an annual rate of -1.25% and Operating profit at 0% over the last 5 years
- The company has a negative book value of Rs 0.55 crore
Flat results in Mar 26
Risky - Negative EBITDA
Stock DNA
Telecom - Services
INR 5 Cr (Micro Cap)
NA (Loss Making)
NA
0.00%
0.48
48.00%
-4.56
Total Returns (Price + Dividend) 
City Online Ser. for the last several years.
Risk Adjusted Returns v/s
Returns Beta

News
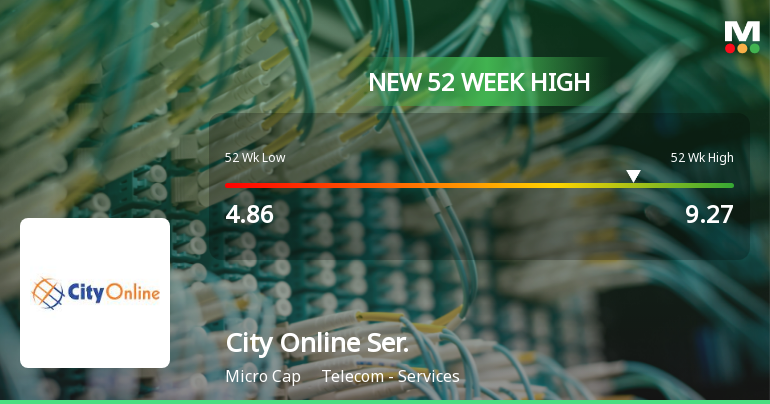
Broad-Based Technical Strength Lifts City Online Services Ltd to 52-Week High of Rs 9.27
With a decisive break above Rs 9.27 on 23 Jun 2026, City Online Services Ltd has reached a fresh 52-week high, propelled by a confluence of bullish technical indicators and sustained price momentum that has seen the stock appreciate 31.86% over the past year, comfortably outperforming the Sensex’s decline of 5.83% in the same period.
Read full news article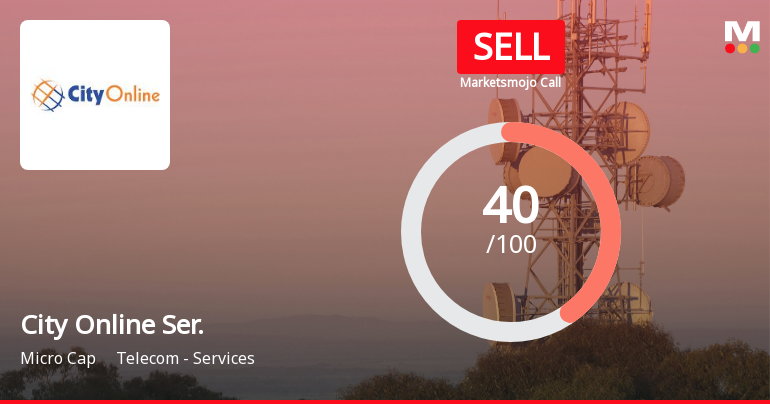
City Online Services Ltd Upgraded to Sell on Technical Improvements Despite Weak Fundamentals
City Online Services Ltd has seen its investment rating upgraded from Strong Sell to Sell, driven primarily by an improved technical outlook amid persistent fundamental challenges. While the company’s financial trends remain flat and valuation metrics unfavourable, recent bullish technical signals have prompted a reassessment of its near-term prospects.
Read full news article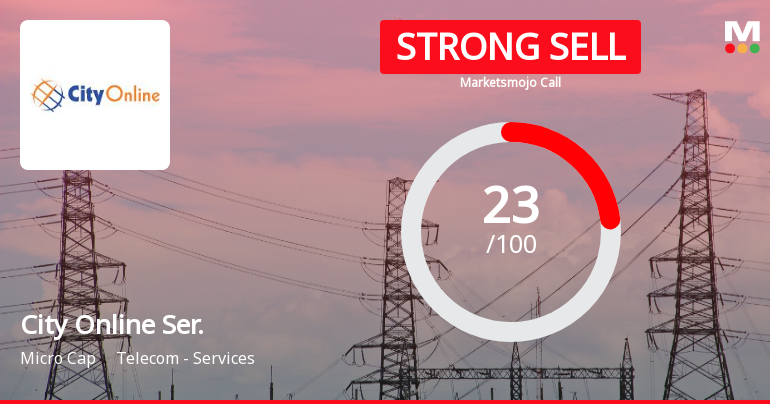
City Online Services Ltd Downgraded to Strong Sell Amid Technical and Fundamental Concerns
City Online Services Ltd has seen its investment rating downgraded from Sell to Strong Sell as of 16 June 2026, reflecting deteriorating technical indicators and persistent fundamental weaknesses. Despite some market-beating returns over the medium term, the company’s financial trends and valuation metrics raise significant concerns for investors.
Read full news article Announcements
Audited Financial Results For The Quarter And Financial Year Ended 31/03/2026
29-May-2026 | Source : BSEAudited Financial Results for the Quarter and Financial Year ended 31/03/2026
Board Meeting Intimation for Considering And Approving Financial Results Of The Company For The Quarter And Financial Year Ended 31.03.2026
25-May-2026 | Source : BSECity Online Services Ltdhas informed BSE that the meeting of the Board of Directors of the Company is scheduled on 29/05/2026 inter alia to consider and approve Financial Results of the Company for the Quarter and Financial Year ended 31.03.2026
Update on board meeting
25-May-2026 | Source : BSECity Online Services Ltdhas informed BSE that the meeting of the Board of Directors of the Company is scheduled on 29/05/2026 inter alia to consider and approve Board Meeting Intimation for Considering And Approving Financial Results Of The Company For The Quarter And Financial Year Ended 31.03.2026
Corporate Actions

No Upcoming Board Meetings

No Dividend history available

No Splits history available

No Bonus history available

No Rights history available
Quality key factors
Valuation key factors
Technicals key factors
 Technical Indicator Scale: Bearish, Mildly Bearish, Sideways, Mildly Bullish, Bullish Turned
 Shareholding Snapshot : Mar 2026
Shareholding Compare (%holding)
Non Institution
None
Held by 1 Schemes (3.87%)
Held by 0 FIIs
Suryadevara Raghava Rao (13.25%)
Krishna Mohan Ramineni (5.24%)
68.78%
Quarterly Results Snapshot (Standalone) - Mar'26 - QoQ

QoQ Growth in quarter ended Mar 2026 is -0.53% vs -2.56% in Dec 2025

QoQ Growth in quarter ended Mar 2026 is -66.67% vs 55.00% in Dec 2025
Half Yearly Results Snapshot (Standalone) - Sep'25
Growth in half year ended Sep 2025 is -1.99% vs -25.69% in Sep 2024
Growth in half year ended Sep 2025 is -500.00% vs 112.24% in Sep 2024
Nine Monthly Results Snapshot (Standalone) - Dec'25
YoY Growth in nine months ended Dec 2025 is -2.01% vs -24.84% in Dec 2024
YoY Growth in nine months ended Dec 2025 is -353.85% vs 130.95% in Dec 2024
Annual Results Snapshot (Standalone) - Mar'26
YoY Growth in year ended Mar 2026 is 2.80% vs -26.73% in Mar 2025
YoY Growth in year ended Mar 2026 is -1,275.00% vs 119.05% in Mar 2025
About City Online Services Ltd

Company Coordinates


