
Compare Clara Industries with Similar Stocks
Total Returns (Price + Dividend) 
Latest dividend: 0.1 per share ex-dividend date: Jun-06-2024
Risk Adjusted Returns v/s
Returns Beta

News
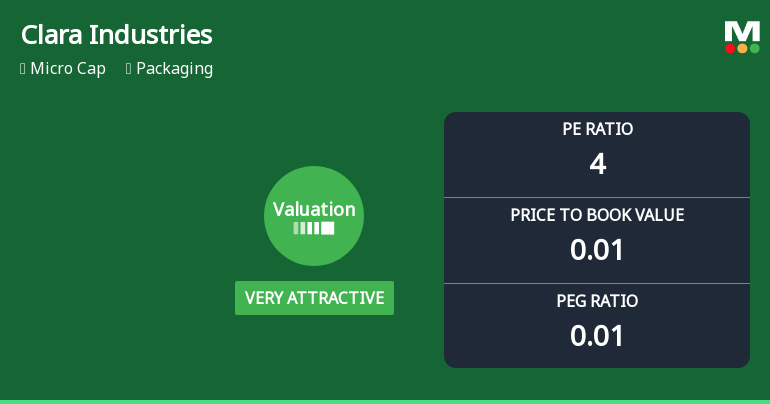
Clara Industries Ltd Valuation Shifts Signal Renewed Price Attractiveness
Clara Industries Ltd has undergone a significant re-rating in its valuation parameters, moving from a risky profile to one deemed very attractive by market standards. Despite operating in the competitive packaging sector and facing a challenging financial backdrop, the company’s current price-to-earnings (P/E) and price-to-book value (P/BV) ratios suggest a compelling entry point for investors seeking value in micro-cap stocks.
Read full news article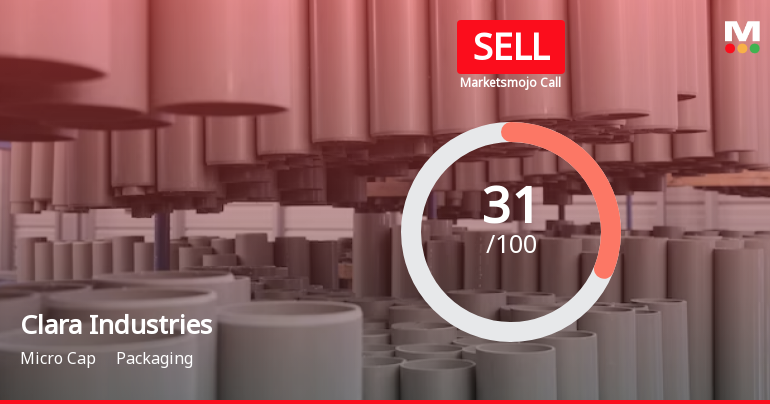
Clara Industries Ltd is Rated Sell
Clara Industries Ltd is rated 'Sell' by MarketsMOJO, with this rating last updated on 01 June 2026. However, the analysis and financial metrics discussed here reflect the stock's current position as of 09 July 2026, providing investors with the latest insights into the company’s performance and outlook.
Read full news article
Clara Industries Ltd is Rated Sell
Clara Industries Ltd is rated Sell by MarketsMOJO, with this rating last updated on 01 June 2026. However, the analysis and financial metrics discussed here reflect the stock’s current position as of 28 June 2026, providing investors with the latest insights into the company’s performance and outlook.
Read full news article Announcements
Compliances-Certificate under Reg. 74 (5) of SEBI (DP) Regulations 2018
15-Jul-2026 | Source : BSE.
Announcement under Regulation 30 (LODR)-Newspaper Publication
04-Jun-2026 | Source : BSE.
Approved The Audited Standalone Financial Statement For The Half Year And Financial Year Ended On March 31 2026
30-May-2026 | Source : BSE.
Corporate Actions

No Upcoming Board Meetings

Clara Industries Ltd has declared 5% dividend, ex-date: 06 Jun 24

No Splits history available

Clara Industries Ltd has announced 4:1 bonus issue, ex-date: 08 Jul 24

Clara Industries Ltd has announced 2:3 rights issue, ex-date: 11 May 23
Quality key factors
Valuation key factors
Technicals key factors
 Technical Indicator Scale: Bearish, Mildly Bearish, Sideways, Mildly Bullish, Bullish Turned
 Shareholding Snapshot : Mar 2026
Shareholding Compare (%holding)
Promoters
None
Held by 0 Schemes
Held by 6 FIIs (31.24%)
Parry Kukreja (29.33%)
North Star Opportunities Fund Vcc-bull Value Incorporated Vcc Sub-fund (9.74%)
20.0%
Quarterly Results Snapshot (Standalone) - Mar'26 - QoQ

QoQ Growth in quarter ended Mar 2026 is 50.84% vs -28.11% in Dec 2025

QoQ Growth in quarter ended Mar 2026 is -90.51% vs 90,000.00% in Dec 2025
Half Yearly Results Snapshot (Standalone) - Sep'25
Growth in half year ended Sep 2025 is -40.13% vs 144.41% in Mar 2025
Growth in half year ended Sep 2025 is -47.90% vs 70.00% in Mar 2025
Nine Monthly Results Snapshot (Standalone) - Mar'26
YoY Growth in nine months ended Mar 2026 is 24.87% vs -15.63% in Mar 2026
YoY Growth in nine months ended Mar 2026 is -3.32% vs -31.34% in Mar 2026
Annual Results Snapshot (Standalone) - Mar'26
YoY Growth in year ended Mar 2026 is -5.05% vs -31.31% in Mar 2025
YoY Growth in year ended Mar 2026 is 1,188.48% vs -48.33% in Mar 2025
About Clara Industries Ltd

Company Coordinates


