
Compare Clean Max Enviro with Similar Stocks
Total Returns (Price + Dividend) 
Clean Max Enviro for the last several years.
Risk Adjusted Returns v/s
Returns Beta

News
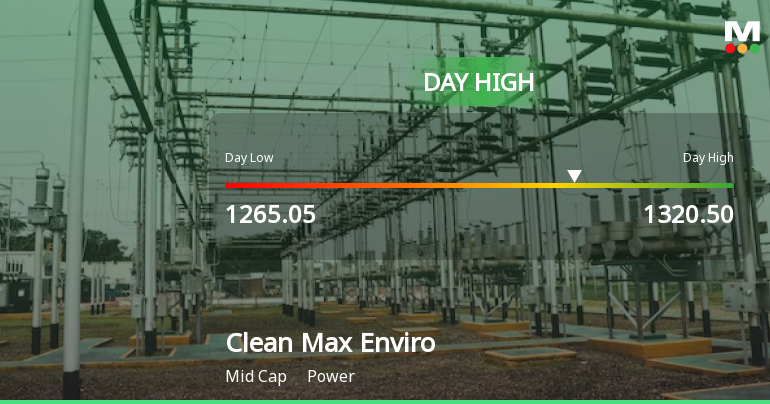
Clean Max Enviro Energy Solutions Ltd Rallies 5.01% and Approaches 20 DMA Resistance — A Key Technical Test Ahead
The Sensex climbed 0.71% on 09 Jul 2026, yet Clean Max Enviro Energy Solutions Ltd outperformed with a 5.01% gain, touching an intraday high of Rs 1320.5. This 4.12 percentage-point outperformance signals a stock-specific momentum shift rather than a broad market lift.
Read full news article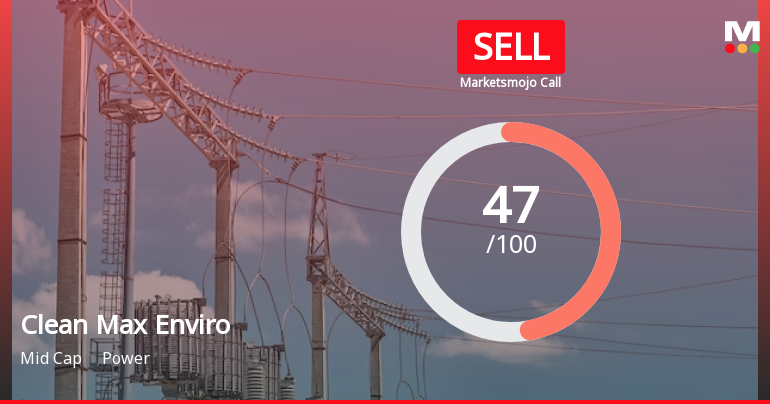
Clean Max Enviro Energy Solutions Downgraded to Sell Amid Technical and Financial Concerns
Clean Max Enviro Energy Solutions Ltd, a mid-cap player in the power sector, has seen its investment rating downgraded from Hold to Sell as of 8 July 2026. The downgrade reflects a combination of deteriorating technical indicators, disappointing quarterly earnings, and valuation concerns, despite some strengths in management efficiency and debt servicing ability.
Read full news article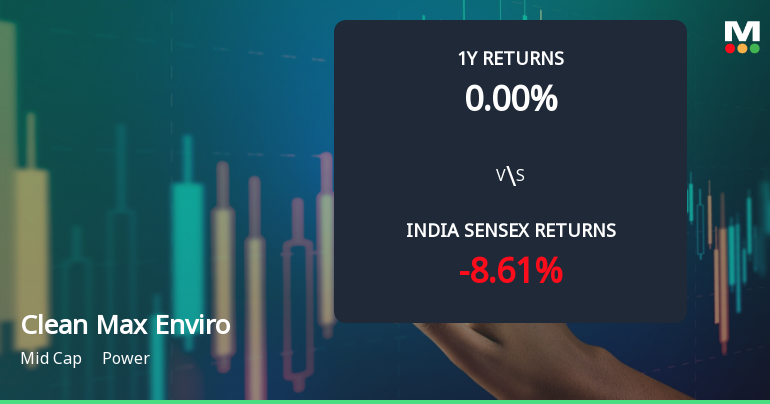
Clean Max Enviro Energy Solutions Ltd Faces Mildly Bearish Technical Shift Amid Market Volatility
Clean Max Enviro Energy Solutions Ltd, a mid-cap player in the power sector, has experienced a notable shift in its technical momentum, moving from a sideways trend to a mildly bearish stance. This change is reflected in key technical indicators such as MACD, RSI, and moving averages, signalling caution for investors amid recent price volatility and underperformance relative to benchmarks.
Read full news article Announcements
Announcement under Regulation 30 (LODR)-Press Release / Media Release
07-Jul-2026 | Source : BSEPress Release dated 7 July 2026 titled CleanMax Delivers Record Commissioning of Over 500MW IN A Single Quarter (Q1 FY 27); Operational Renewable Energy Portfolio stands at 4.2 GW issued by Clean Max Enviro Energy Solutions Limited
Announcement under Regulation 30 (LODR)-Newspaper Publication
01-Jul-2026 | Source : BSEEnclosed herewith newspaper advertisement for information regarding 16th Annual General Meeting of the Company to be held on Friday 24 July 2026.
Intimation Of Dispatch Of Letter To The Shareholders
01-Jul-2026 | Source : BSEIntimation of dispatch of letter to the Shareholders
Corporate Actions

No Upcoming Board Meetings

No Dividend history available

No Splits history available

No Bonus history available

No Rights history available
Quality key factors
Valuation key factors
Technicals key factors
 Technical Indicator Scale: Bearish, Mildly Bearish, Sideways, Mildly Bullish, Bullish Turned
 Shareholding Snapshot : Mar 2026
Shareholding Compare (%holding)
Promoters
20.0202
Held by 8 Schemes (2.26%)
Held by 36 FIIs (29.8%)
Bgtf One Holdings (difc) Limited (21.31%)
Augment India I Holding Llc (9.52%)
3.32%
Quarterly Results Snapshot (Standalone) - Mar'26 - QoQ

QoQ Growth in quarter ended Mar 2026 is 24.69% vs 4.34% in Dec 2025

QoQ Growth in quarter ended Mar 2026 is -53.94% vs 13.07% in Dec 2025
Half Yearly Results Snapshot (Standalone) - Sep'25
Not Applicable: The company has declared_date for only one period
Not Applicable: The company has declared_date for only one period
Nine Monthly Results Snapshot (Standalone) - Dec'25
Not Applicable: The company has declared_date for only one period
Not Applicable: The company has declared_date for only one period
Annual Results Snapshot (Standalone) - Mar'26
YoY Growth in year ended Mar 2026 is 164.42% vs 7.78% in Mar 2025
YoY Growth in year ended Mar 2026 is 157.39% vs 5.57% in Mar 2025
About Clean Max Enviro Energy Solutions Ltd

Company Coordinates


